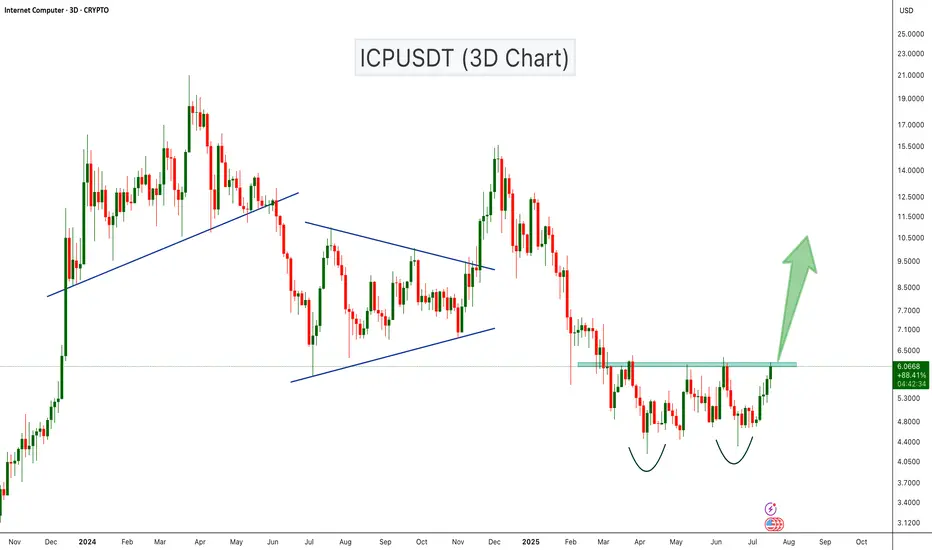
ICPUSDT Double Bottom Breakout Loading?ICPUSDT is showing a strong bullish setup with a classic double bottom pattern forming on the 3-day chart. The price has tested the support zone twice and is now approaching the neckline resistance around the $6.10 level. A confirmed breakout above this resistance could trigger a strong bullish move toward the next key resistance levels near $9.50 and $15.
Cheers
Hexa
ICPBTC
#ICP/USDT#ICP
The price is moving within a descending channel on the 1-hour frame, adhering well to it, and is heading towards a strong breakout and retest.
We are experiencing a rebound from the lower boundary of the descending channel, which is support at 5.85.
We are experiencing a downtrend on the RSI indicator that is about to be broken and retested, supporting the upward trend.
We are heading towards stability above the 100 Moving Average.
Entry price: 6.04
First target: 6.13
Second target: 6.28
Third target: 6.50

$ICP: Internet Computercup and handle on the weekly timeframe with a trend line breakout, double retest, oversold rsi, and bullish looking mac d. do whatever you like with this information. not financial advice, gaming advice 🎮
CRYPTOCAP:ICP
BINANCE:ICPUSDT
COINBASE:ICPUSD
BINANCE:ICPUSD

ICP Is Bearish For MidTerm (3D)On the chart, it appears that we have a large-degree ABC structure, where Wave B formed a triangle and has now completed.
Wave C should take more time than Wave A. Since Wave B has retraced 0.382% of Wave A, it is expected that Wave C will also be deep
We have marked the price and time boxes on the chart.
A daily candle closing above the invalidation level will invalidate this analysis
For risk management, please don't forget stop loss and capital management
Comment if you have any questions
Thank You

ICP/USDT(BUY)hello friends
Despite the fall of this currency, we are now at the price floor and good conditions have been provided for buying, of course, with capital management...
*Trade safely with us*

Wave2 Nearing Completion: Bullish Momentum for Internet ComputerWave 2 Analysis
Wave structure analysis suggests that ICP has been following a five-wave impulse pattern. The first wave began in December after ICP hit a low of $2.70 in September. By March, ICP surged to a high of $21, marking the end of the first wave. The second wave, which is a corrective wave, saw ICP retracing to the 0.786 Fibonacci retracement level of $6.58 by July. This level has been retested multiple times, indicating strong support.
Current Market Sentiment
The recent price movements show that ICP has been trading sideways, forming an ascending triangle pattern. This pattern is typically a bullish continuation pattern, suggesting that the price might break out upwards. The Relative Strength Index (RSI) indicates that ICP is not overbought, providing room for further upward movement.
AI Narrative and Decentralized Cloud
The AI narrative and the shift towards decentralized cloud solutions are significant factors contributing to the bullish outlook for ICP. Centralized cloud providers like AWS, Microsoft Azure, and Google Cloud dominate the market, but they also pose challenges such as high costs, regulatory issues, and susceptibility to political pressures. Decentralized alternatives like Internet Computer aim to democratize cloud infrastructure, reducing reliance on centralized entities and fostering innovation.
Conclusion
Given the wave structure analysis, strong support levels, and the growing narrative around AI and decentralized cloud solutions, ICP is poised for a potential bullish breakout. If the price breaks above the ascending resistance, it could mark the beginning of the third wave in the five-wave impulse pattern, leading to significant price appreciation.

ICP / ICPUSDTGood Luck >>
• Warning •
Any deal I share does not mean that I am forcing you to enter into it, you enter in with your full risk, because I'll not gain any profits with you in the end.
The risk management of the position must comply with the stop loss.
(I am not sharing financial or investment advice, you should do your own research for your money.)

ICPUSDT Analysis: Key Resistance and Potential DropThe red box marks the first serious resistance point for ICPUSDT. If the price fails to break above this level, it may fall towards the blue box . However, if the price breaks through with volume and retests this level, there’s minimal resistance ahead, and the price could rise significantly.
Key Points:
Red Box: This is the first major resistance. A failure to break it could lead to a drop towards the blue box.
Break and Retest: If the price breaks the red box with volume and retests, it may continue higher due to lack of resistance.
Confirmation Indicators: Validate entries with CDV, liquidity heatmaps, volume profiles, volume footprints , and upward market structure breaks in lower time frames.
Learn With Me: Want to learn how to use CDV, liquidity heatmaps, volume profiles, and volume footprints to identify key demand zones? DM me for details.
If this analysis helps you, please don’t forget to boost and comment. Your support motivates me to share more!
If you think this analysis helps you, please don't forget to boost and comment on this. These motivate me to share more insights with you!
I keep my charts clean and simple because I believe clarity leads to better decisions.
My approach is built on years of experience and a solid track record. I don’t claim to know it all, but I’m confident in my ability to spot high-probability setups.
If you would like to learn how to use the heatmap, cumulative volume delta and volume footprint techniques that I use below to determine very accurate demand regions, you can send me a private message. I help anyone who wants it completely free of charge.
My Previous Analysis
🎯 ZENUSDT.P: Patience & Profitability | %230 Reaction from the Sniper Entry
🐶 DOGEUSDT.P: Next Move
🎨 RENDERUSDT.P: Opportunity of the Month
💎 ETHUSDT.P: Where to Retrace
🟢 BNBUSDT.P: Potential Surge
📊 BTC Dominance: Reaction Zone
🌊 WAVESUSDT.P: Demand Zone Potential
🟣 UNIUSDT.P: Long-Term Trade
🔵 XRPUSDT.P: Entry Zones
🔗 LINKUSDT.P: Follow The River
📈 BTCUSDT.P: Two Key Demand Zones
🟩 POLUSDT: Bullish Momentum
🌟 PENDLEUSDT.P: Where Opportunity Meets Precision
🔥 BTCUSDT.P: Liquidation of Highly Leveraged Longs
🌊 SOLUSDT.P: SOL's Dip - Your Opportunity
🐸 1000PEPEUSDT.P: Prime Bounce Zone Unlocked
🚀 ETHUSDT.P: Set to Explode - Don't Miss This Game Changer
🤖 IQUSDT: Smart Plan
⚡️ PONDUSDT: A Trade Not Taken Is Better Than a Losing One
💼 STMXUSDT: 2 Buying Areas
🐢 TURBOUSDT: Buy Zones and Buyer Presence
🌍 ICPUSDT.P: Massive Upside Potential | Check the Trade Update For Seeing Results
🟠 IDEXUSDT: Spot Buy Area | %26 Profit if You Trade with MSB
📌 USUALUSDT: Buyers Are Active + %70 Profit in Total
🌟 FORTHUSDT: Sniper Entry +%26 Reaction
🐳 QKCUSDT: Sniper Entry +%57 Reaction
📊 BTC.D: Retest of Key Area Highly Likely
I stopped adding to the list because it's kinda tiring to add 5-10 charts in every move but you can check my profile and see that it goes on..

ICP | Massive Upside PotentialWe have shared many analyzes here and achieved pinpoint success in most of them.
Have some trust in the brand, this is XU99.
I'm longing from bluebox.
There is a nice volume in ICP. Sounds like it gives a sweet buy on Sunday evening's pullback.
I don't overcomplicate things and add a ton of dirty crap to my charts, but you can check out the success of my analysis below.
I approach trading with confidence backed by experience and past success in identifying high-probability setups.
While I don’t claim to be the best, my track record speaks for itself, and I strive to let my analysis and results do the talking. Watch these levels closely—markets can confirm what charts already whisper. Let’s see how this plays out together.
My Previous Hits
🐶 DOGEUSDT.P | 4 Reward for 1 Risk (or more if you’re bold).
DOGEUSDT.P: Next Move
🎨 RENDERUSDT.P | HTF Sniper Precision
RENDERUSDT.P: Opportunity of the Month
💎 ETHUSDT.P | Buyer Zone So Accurate You’ll Double Check
ETHUSDT.P: Where to Retrace
🟢 BNBUSDT.P | Buyer Zone Mastery (CZ vibes).
BNBUSDT.P: Potential Surge
📊 Bitcoin Dominance | Called it Like a Pro
BTC Dominance: Reaction Zone
🌊 WAVESUSDT.P | The Blue Box: A Demand Zone with Potential
WAVESUSDT.P: Demand Zone Potential
🟣 UNIUSDT.P | Long-Term Trade
UNIUSDT.P: Long-Term Trade
Now sit back, relax, and watch the market do its thing. Or don’t, FOMO is real. 😉

#ICP/USDT / Ready to go up#ICP
The price is moving in a descending channel on the 12-hour frame and sticking to it well
We have a bounce from the lower limit of the descending channel, this support is at 6.90
We have a downtrend, the RSI indicator is about to break, which supports the rise
We have a trend to stabilize above the moving average 100
Entry price 9.00
First target 9.47
Second target 10.00
Third target 10.50

The ICP/BTC pair is in a multi-year bullish divergenceThe ICP/BTC pair is in a multi-year bullish divergence. If Bitcoin reaches $230,000 at its peak next year and #ICP returns to the opening price of its first monthly candle, which is 0.0043210 BTC (yellow line) per CRYPTOCAP:ICP , it will equivalent to $993.83 per ICP. It means you would only need 1,006.21 ICP to become an ICP MILLIONAIRE.
♾🚀 LFG!

#ICP/USDT#ICP
The price is moving in a descending channel on the 1-hour frame and we are about to break it
We have a bounce from a major support area in green at 6.75
We have an uptrend RSI that has been broken upwards which supports the upside
We have a trend to stabilize above the 100 moving average which supports the upside
Entry price 7.00
First target 7.41
Second target 8.02
Third target 8.66

ICP - Support holding strong, bounce back expectedBINANCE:ICPUSDT (1W CHART) Technical Analysis Update
ICP is currently trading at $79 and price has made significant retrace and currently it is around the support zone. We are expecting this support zone to hold price to bounce back from this support zone. We can enter a long term trade here and do DCA if the price falls down
If the weekly candle closes below the support zone then we can enter a short trade.
Entry level: $ 7.9
Stop Loss Level: $ 5.0
TakeProfit 1: $ 10.181
TakeProfit 2: $ 13.506
TakeProfit 3: $ 19.259
TakeProfit 4: $ 30.912
TakeProfit 5: $ 52.987
TakeProfit 6: $ 76.559
Max Leverage: 2x
Position Size: 1% of capital
Remember to set your stop loss.
Follow our TradingView account for more technical analysis updates. | Like, share, and comment your thoughts.
Cheers
GreenCrypto

#ICP/USDT#ICP
The price is moving within a descending channel pattern on the 4-hour frame, which is a retracement pattern
We have a bounce from a major support area in the color EUR at 7.30
We have a tendency to stabilize above the Moving Average 100
We have a downtrend on the RSI indicator that supports the rise and gives greater momentum and the price is based on it
Entrance price: 8.10
First target 9.05
Second goal 10.04
Third goal 11.38

Internet Computer | ICP The price of ICP is $ 6.6 today with a 24hour trading volume of 122 million dollars, this represents a 17% price increase since last week and a 31% price increase since last month
The Internet Computer blockchain incorporates a radical rethink of blockchain design, powered by innovations in cryptography. It provides the first “World Computer” blockchain that can be used to build almost any Web 2.0 online system or service, and web3 services, including web3 social media services, without any need for centralized traditional IT such as cloud computing services. It also enables smart contracts it hosts to directly create transactions on other blockchains, which in turn enables the full end-to-end decentralization of online services and web3
The project was founded in October 2016 by Dominic Willams and has raised a total of $121 million from investors such as Adreessen Horowitz, Polychain Capital, Multicoin Capital...
now lets talk about the chart, as you can see ICP try to break the downtrend (red lines) , the price turned up on April 27 and started a strong recovery. bulls won point of control and candles are above Ema 50 . the RSI has jumped into positive territory as well. bulls also try to hit 6.9 first then 7.5$

#ICP/USDT#ICP
The price is moving within a bearish channel on a 4-hour frame and is strongly committed to it.
We have a support area at 11.80 and we bounced from it at the lower border of the channel
We have a tendency to stabilize above the Moving Average 100
We have a downtrend on the RSI indicator that supports the rise
Entry price is 12.00
First target 12.62
The second goal is 13.00
Third goal 13.54

ICP: pollback📊Analysis by AhmadArz:
🔍Entry: 12.619
🛑Stop Loss: 12.363
🎯Take Profit: 13 - 13.438 - 13.853 - 14.581 - 16
🔗"Uncover new opportunities in the world of cryptocurrencies with AhmadArz.
💡Join us on TradingView and expand your investment knowledge with our five years of experience in financial markets."
🚀Please boost and💬 comment to share your thoughts with us!

ICP: down-trend📊Analysis by AhmadArz:
🔍Entry:12.245
🛑Stop Loss: 12.524
🎯Take Profit: 12.019 - 11.827 - 11.596 - 11.433
🔗"Uncover new opportunities in the world of cryptocurrencies with AhmadArz.
💡Join us on TradingView and expand your investment knowledge with our five years of experience in financial markets."
🚀Please boost and💬 comment to share your thoughts with us!

ICP Pomp to 44 % ?We have been supported by an upward trendline for a considerable period. However, for the past few days, we have been trading below a downward trendline, and the consolidation is intensifying. Both bullish and bearish scenarios are worth considering.
In a bullish scenario, we could anticipate a breakout above 13.97 with the specified targets in mind. Conversely, if the price breaks down below the 11.93 zone, we could accompany the downtrend until the 8.99 target.
Which direction are you anticipating?

#ICP/USDT#ICP
The price is moving in a bearish channel pattern on the 4-hour frame and sticking to it well
The price rebounded well from the lower border of the channel at the green support level of 11.50
We have a tendency to stabilize above the Moving Average 100
We have oversold resistance on the RSI indicator to support the rise, with a downtrend about to break higher
Entry price is 12.60
The first goal is 13.50
Second goal 15.18
Third goal 16.40

ICP / ICPUSDTGood Luck >>
• Warning •
Any deal I share does not mean that I am forcing you to enter into it, you enter in with your full risk, because I'll not gain any profits with you in the end.
The risk management of the position must comply with the stop loss.
(I am not sharing financial or investment advice, you should do your own research for your money.)

ICPUSDT 1W LONG📈Hi all. Timeframe 1 week. After a long fall, ICPUSDT has formed a descending channel and is located at its resistance. I’m considering recruiting to the spot now with a pick-up from the green zone (unlikely). Also long during a breakdown/retest of resistance. In principle, you can already look for an entry on a lower timeframe. Marked goals and levels on the chart.

#ICP/USDT#ICP
We have a 4-hour frame channel, the price moves within it and adheres to its limits well
We have a higher stability moving average of 100
We have a downtrend on the RSI that is about to break higher
Entry price is 17.00
The first target is 18.90
Second goal 20.00
Third goal 21.19
