icp short tradein my opinion this is a good trade with a good r/r
hope it hit the target
consider this is my trade not your trade and i just like to share my trades with world
ICPUSD
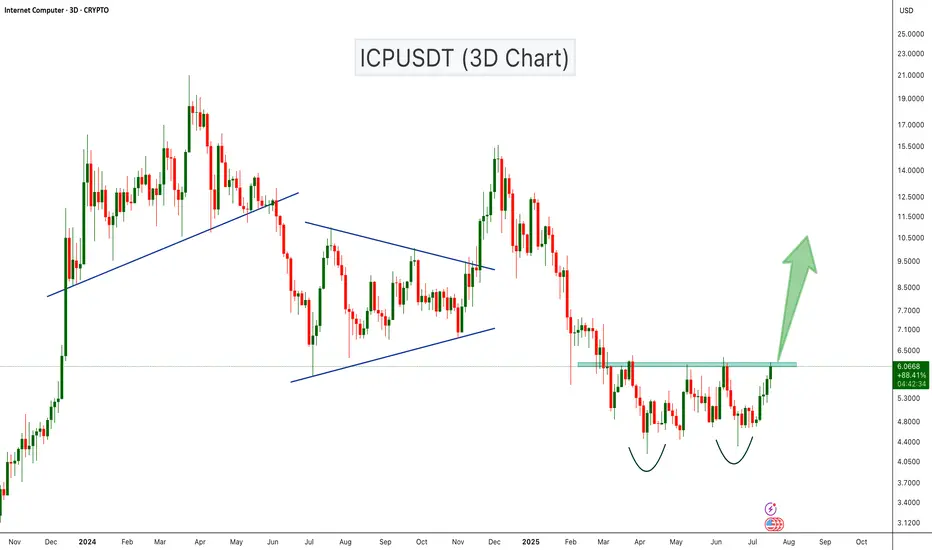
ICPUSDT Double Bottom Breakout Loading?ICPUSDT is showing a strong bullish setup with a classic double bottom pattern forming on the 3-day chart. The price has tested the support zone twice and is now approaching the neckline resistance around the $6.10 level. A confirmed breakout above this resistance could trigger a strong bullish move toward the next key resistance levels near $9.50 and $15.
Cheers
Hexa
ICP still in the reload support zone....W pattern.
I like it down here.
Low risk accumulation block given the backdrop of #altseason going on.
Enjoy.
;)
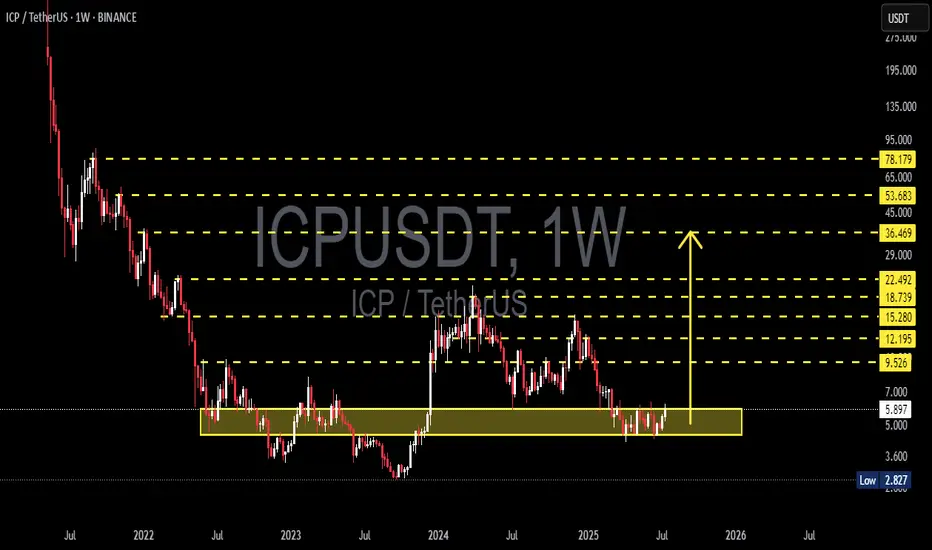
ICP/USDT Weekly Analysis: Multi-Year Accumulation Base🔍 Macro Outlook & Context:
ICP has been in a prolonged downtrend since its initial listing, dropping over 95% from its all-time high. However, since late 2022, ICP has been forming a strong and well-defined accumulation base between the $3.00 – $6.00 range.
Currently, price action and structure indicate that a potential breakout from this multi-year base is imminent. The setup is beginning to mirror a Wyckoff Accumulation Phase, where smart money accumulates quietly before launching into the next markup phase.
📐 Technical Structure & Pattern Breakdown:
✅ Accumulation Zone
Over 80 weeks of consolidation within a tight horizontal range.
This forms a strong foundation for a powerful breakout move if confirmed.
✅ Multiple Bottom Formation
Repeated failures to break below $3.50 suggest growing bullish pressure and seller exhaustion.
✅ Bullish Compression
Higher lows forming inside the range.
Resistance at $6.00 is being tested more frequently, indicating a breakout buildup.
✅ Volume Profile
Declining volume during sideways action = typical of supply exhaustion.
Surge in volume during breakout would confirm entry into markup phase.
🚀 Bullish Scenario (Primary Setup):
If price breaks and closes above $6.00 on the weekly timeframe:
Key Resistance Targets:
$9.52 → $12.19 → $15.28 → $18.73 → $22.49
Extended Bull Market Targets:
$29 → $36 → $45+
Potential ROI from base zone: +200% to +600%
Bullish Confirmation Signals:
Strong weekly candle close above $6.00
Volume breakout
RSI crossing 50 and MACD bullish crossover
🐻 Bearish Scenario (Alternative):
If the breakout fails and rejection occurs at $6.00:
Possible retracement back to lower support zones:
$4.50 → $3.00
A breakdown below $3.00 would invalidate the bullish structure and open risk for new lows.
Bearish Red Flags:
Long upper wick near resistance without volume
RSI drops back under 40
Breakdown of $3.50–$4.00 support zone
📊 Trading Strategy & Risk Management:
Entry Type Price Range
Breakout Entry $6.20–$6.50
Conservative SL $5.20
Aggressive SL $4.70
TP Range $9.5 to $22.4
Long-Term TP Up to $45+
Use scaled take-profits to secure gains gradually and reduce risk.
🧠 Market Sentiment & Psychology:
Sentiment is slowly shifting from fear to anticipation. Long-term accumulators and institutional players often target setups like this — low prices with solid structure and untapped upside. If breakout confirms, ICP could become one of the top-performing altcoins of the next cycle.
> “Accumulation is where smart money buys. Breakout is where the public chases.”
📌 Final Thoughts:
ICP/USDT is at its most critical point in over two years. A confirmed breakout from this long-standing base could be the launchpad for a multi-stage rally. This is a setup worth watching closely — or acting on with tight risk control.
#ICPUSDT #CryptoBreakout #AltcoinAnalysis #TechnicalAnalysis #WyckoffAccumulation #LongTermSetup #CryptoReversal #BullishCrypto #ICPAnalysis #AltcoinSeason #BreakoutTrade #Cryptocurrency

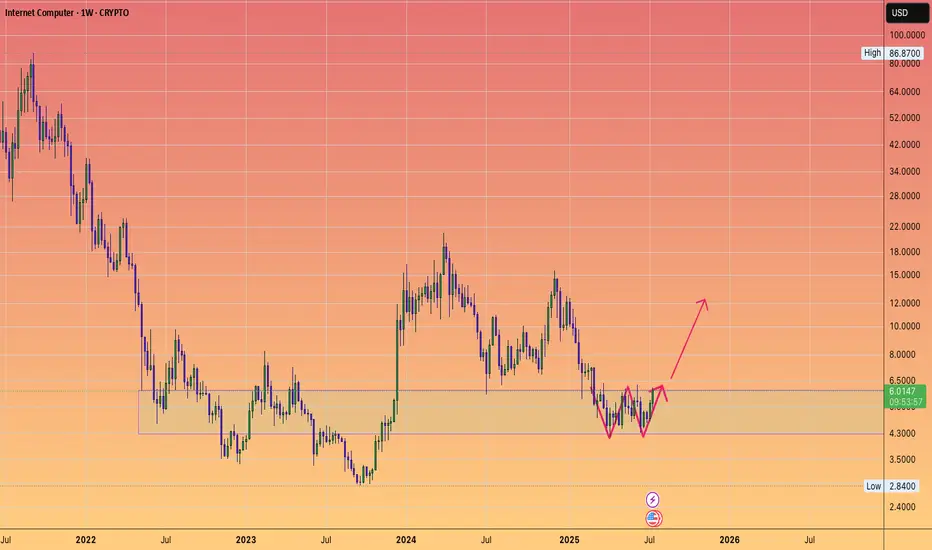
ICPUSDT 1W AnalysisICP ~ 1W Analysis
#ICP If you still have confidence in this coin, maybe you can consider this support to start buying back from here, with a short-term target of at least 15%++

#ICP/USDT#ICP
The price is moving within a descending channel on the 1-hour frame, adhering well to it, and is heading towards a strong breakout and retest.
We are experiencing a rebound from the lower boundary of the descending channel, which is support at 5.85.
We are experiencing a downtrend on the RSI indicator that is about to be broken and retested, supporting the upward trend.
We are heading towards stability above the 100 Moving Average.
Entry price: 6.04
First target: 6.13
Second target: 6.28
Third target: 6.50

ICP ROADMAPTo me the view is pretty clear.
* The purpose of my graphic drawings is purely educational.
* What i write here is not an investment advice. Please do your own research before investing in any asset.
* Never take my personal opinions as investment advice, you may lose your money.

ICP - Perfect Long OpportunityDescription
---------------------------------------------------------------
+ ICP has started reversal inside the channel and the price is heading towards the resistance zone, this gives a bullish trade opportunity.
---------------------------------------------------------------
VectorAlgo Trade Details
------------------------------
Entry Price: 5.3
Stop Loss: 3.3
------------------------------
Target 1: 6.9
Target 2: 12.7
Target 3: 22.5
------------------------------
Timeframe: 1W
Capital Risk: 1-2% of trading amount
Leverage: 5-10x
---------------------------------------------------------------
Enhance, Trade, Grow
---------------------------------------------------------------
Feel free to share your thoughts and insights. Don't forget to like and follow us for more trading ideas and discussions.
Best Regards,
VectorAlgo

ICPUSDT 1D AnalysisICP ~ 1D Analysis
#ICP Buy gradually from here if you still have confidence in this coin with a short term target of at least 10%+ from here.

$ICP: Internet Computercup and handle on the weekly timeframe with a trend line breakout, double retest, oversold rsi, and bullish looking mac d. do whatever you like with this information. not financial advice, gaming advice 🎮
CRYPTOCAP:ICP
BINANCE:ICPUSDT
COINBASE:ICPUSD
BINANCE:ICPUSD


ICPUSDT 1D AnalysisICP ~ 1D Analysis
#ICP Buy gradually after successfully breaking through this resistance line, with a short-term target of at least 10% gain.

ICP Is Bearish For MidTerm (3D)On the chart, it appears that we have a large-degree ABC structure, where Wave B formed a triangle and has now completed.
Wave C should take more time than Wave A. Since Wave B has retraced 0.382% of Wave A, it is expected that Wave C will also be deep
We have marked the price and time boxes on the chart.
A daily candle closing above the invalidation level will invalidate this analysis
For risk management, please don't forget stop loss and capital management
Comment if you have any questions
Thank You

ICP/USDT(BUY)hello friends
Despite the fall of this currency, we are now at the price floor and good conditions have been provided for buying, of course, with capital management...
*Trade safely with us*


ICP / ICPUSDTGood Luck >>
• Warning •
Any deal I share does not mean that I am forcing you to enter into it, you enter in with your full risk, because I'll not gain any profits with you in the end.
The risk management of the position must comply with the stop loss.
(I am not sharing financial or investment advice, you should do your own research for your money.)

ICPUSDT 1WICP ~ 1W
#ICP If you still have Conviction on this coin,. Buy in stages from here with a minimum target of 20%++

$ICP to $90ICP to $90
CRYPTOCAP:ICP made an appearance on the netflix show inside job 🤡
CRYPTOCAP:ICP will go to $1000 this cycle

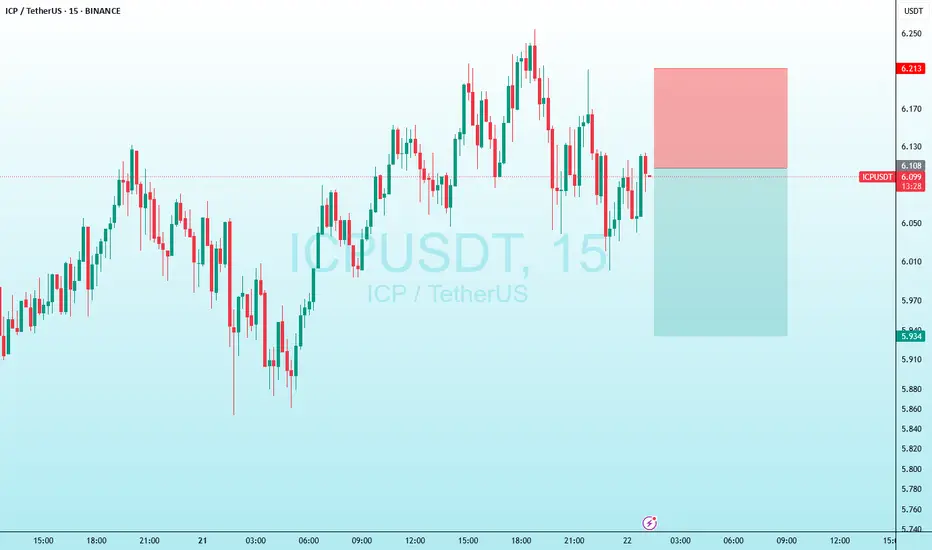
ICPUSDT Analysis: Key Resistance and Potential DropThe red box marks the first serious resistance point for ICPUSDT. If the price fails to break above this level, it may fall towards the blue box . However, if the price breaks through with volume and retests this level, there’s minimal resistance ahead, and the price could rise significantly.
Key Points:
Red Box: This is the first major resistance. A failure to break it could lead to a drop towards the blue box.
Break and Retest: If the price breaks the red box with volume and retests, it may continue higher due to lack of resistance.
Confirmation Indicators: Validate entries with CDV, liquidity heatmaps, volume profiles, volume footprints , and upward market structure breaks in lower time frames.
Learn With Me: Want to learn how to use CDV, liquidity heatmaps, volume profiles, and volume footprints to identify key demand zones? DM me for details.
If this analysis helps you, please don’t forget to boost and comment. Your support motivates me to share more!
If you think this analysis helps you, please don't forget to boost and comment on this. These motivate me to share more insights with you!
I keep my charts clean and simple because I believe clarity leads to better decisions.
My approach is built on years of experience and a solid track record. I don’t claim to know it all, but I’m confident in my ability to spot high-probability setups.
If you would like to learn how to use the heatmap, cumulative volume delta and volume footprint techniques that I use below to determine very accurate demand regions, you can send me a private message. I help anyone who wants it completely free of charge.
My Previous Analysis
🎯 ZENUSDT.P: Patience & Profitability | %230 Reaction from the Sniper Entry
🐶 DOGEUSDT.P: Next Move
🎨 RENDERUSDT.P: Opportunity of the Month
💎 ETHUSDT.P: Where to Retrace
🟢 BNBUSDT.P: Potential Surge
📊 BTC Dominance: Reaction Zone
🌊 WAVESUSDT.P: Demand Zone Potential
🟣 UNIUSDT.P: Long-Term Trade
🔵 XRPUSDT.P: Entry Zones
🔗 LINKUSDT.P: Follow The River
📈 BTCUSDT.P: Two Key Demand Zones
🟩 POLUSDT: Bullish Momentum
🌟 PENDLEUSDT.P: Where Opportunity Meets Precision
🔥 BTCUSDT.P: Liquidation of Highly Leveraged Longs
🌊 SOLUSDT.P: SOL's Dip - Your Opportunity
🐸 1000PEPEUSDT.P: Prime Bounce Zone Unlocked
🚀 ETHUSDT.P: Set to Explode - Don't Miss This Game Changer
🤖 IQUSDT: Smart Plan
⚡️ PONDUSDT: A Trade Not Taken Is Better Than a Losing One
💼 STMXUSDT: 2 Buying Areas
🐢 TURBOUSDT: Buy Zones and Buyer Presence
🌍 ICPUSDT.P: Massive Upside Potential | Check the Trade Update For Seeing Results
🟠 IDEXUSDT: Spot Buy Area | %26 Profit if You Trade with MSB
📌 USUALUSDT: Buyers Are Active + %70 Profit in Total
🌟 FORTHUSDT: Sniper Entry +%26 Reaction
🐳 QKCUSDT: Sniper Entry +%57 Reaction
📊 BTC.D: Retest of Key Area Highly Likely
I stopped adding to the list because it's kinda tiring to add 5-10 charts in every move but you can check my profile and see that it goes on..

icp long scenario dec 16 2024icp long scenario dec 16 2024. last areas to buy icp cheap before the train leaves the station for good...

ICP | Massive Upside PotentialWe have shared many analyzes here and achieved pinpoint success in most of them.
Have some trust in the brand, this is XU99.
I'm longing from bluebox.
There is a nice volume in ICP. Sounds like it gives a sweet buy on Sunday evening's pullback.
I don't overcomplicate things and add a ton of dirty crap to my charts, but you can check out the success of my analysis below.
I approach trading with confidence backed by experience and past success in identifying high-probability setups.
While I don’t claim to be the best, my track record speaks for itself, and I strive to let my analysis and results do the talking. Watch these levels closely—markets can confirm what charts already whisper. Let’s see how this plays out together.
My Previous Hits
🐶 DOGEUSDT.P | 4 Reward for 1 Risk (or more if you’re bold).
DOGEUSDT.P: Next Move
🎨 RENDERUSDT.P | HTF Sniper Precision
RENDERUSDT.P: Opportunity of the Month
💎 ETHUSDT.P | Buyer Zone So Accurate You’ll Double Check
ETHUSDT.P: Where to Retrace
🟢 BNBUSDT.P | Buyer Zone Mastery (CZ vibes).
BNBUSDT.P: Potential Surge
📊 Bitcoin Dominance | Called it Like a Pro
BTC Dominance: Reaction Zone
🌊 WAVESUSDT.P | The Blue Box: A Demand Zone with Potential
WAVESUSDT.P: Demand Zone Potential
🟣 UNIUSDT.P | Long-Term Trade
UNIUSDT.P: Long-Term Trade
Now sit back, relax, and watch the market do its thing. Or don’t, FOMO is real. 😉

Will ICP reach $40?BINANCE:ICPUSDT was in a downtrend throughout the 2022-2023 period. However, with the start of 2024, the first bullish move pushed the price from $3 to $20.
The selling pressure in the $20-23 range was not surprising, and the resulting decline caused the price to drop by as much as 72%.
The second half of 2024 mostly consisted of consolidation. Following the election results in the United States, the price began trending upward again.
I believe the price will continue its upward movement from the last consolidation zone, first reaching $23 and then potentially moving towards $38.
The positive market sentiment and notable advancements in ICP's use cases will likely support the price.
