$3 incomingThe wedge has clearly broken on the downside, RSI is not showing a trend change anytime soon, this will be hard to believe for the people that bought ICP for $500, but it looks like the downtrend will bring this altcoin to $3. What is DFINITY ever going to produce in our lifetime that will bring this back to $500. The altcoin market is the biggest ponzi scheme of our generation, people staying invested should be prepared to loose it all.
ICPUSD

ICP/USDT | Seems like Bottomed out & Ready to FLY..!!
#ICP Seems like Bottomed out & Ready to FLY..!!
- Falling Wedge Formation in 3-Days TF..
- RSI is Printing Bullish Divergence..
- Bulls need some sort of Volume for upside Breakout.
+250-270% Profit Potential in the Midterm.. ✍️
Please like the idea for Support & Subscribe for More ideas like this and share your ideas and charts in Comments Section..!!
Thanks for Your Love & Support..!!

ICP inverted H&S*log scale
Internet Computer is approaching the major downtrendline which dominated for almost a year. Price forming Inverted Head and Shoulders 🤷 so it looks like price may be bottoming but still too early to say! IF price breaks the Neckline @ 9.8 and the major downtrendline then I think there is chance for run to 14.9 and even higher. Check how the iH&S target coincides with important market structure (yellow).
ENTRY : Neckline break @ 9.8
STOPLOSS (SL) : Left Shoulder @ 6.75
TARGET (TP) : Inverted H&S target projection @ 14.9 (view reg scale to do the projection Head-Neckline = Neckline-Target)
REWARD RISK RATIO (RRR) : 1.5
INVALIDATION : when SL level hit (Left Shoulder @ 6.75)
Check my other stuff in related ideas.
Please boost🚀, comment🗣️, follow me✒️, enjoy📺!
⚠️Disclaimer: I'm not financial advisor. This is not a financial advice. Do your own due dilingence.

Internet Computer (ICP) formed Cypher | A good buy opportunityHi dear friends, hope you are well and welcome to the new trade setup of Internet Computer (ICP) with US Dollar pair.
Previously we caught a nice pump of ICP as below:
Now on hourly time frame, ICP has formed a bullish Cypher move.
Note: Above idea is for educational purpose only. It is advised to diversify and strictly follow the stop loss, and don't get stuck with trade

ICP - meme the dreamInternet Computer Coin getting shilled/memed by 4chan
do they have the meme power to turn this around? idk.
but if the dev's are still working... then I like buying charts that look dead. <3

viewpoint Short For ICPHi, dear traders. how are you ? Today we have a viewpoint to SELL/SHORT the ICP symbol.
For risk management, please don't forget stop loss and capital management
When we reach the first target, save some profit and then change the stop to entry
Comment if you have any questions
Thank You

Falling wedgeThe price of ICP Internet Computer appears to be locked in a falling wedge on the weekly time frame, which means that the price is in a downward spiral that is tightening to the downside putting more pressure on the market and eventually a breakout will follow. On the RSI a slight positive divergence and the MACD which has been up for some time but is still below the 0 line.
Grab the daily time frame and here I grab the latest downtrend within the formation above which falls nicely into a downtrend channel . The EW also fits nicely into this and these readings are also respected, though I did add an alternative wave 5. Then attention to the Broadening wedge , which in the EW is sometimes called an Expanding triangle. As it looks now, the MACD seems to bend upwards and thus we create positive divergence which somewhere then fits nicely into the story of the weekly timeframe in addition to that when crossing the 0 line this can be seen as a trend change. Should the current support of the Broadening wedge break down, I expect that we can go down towards $2.50.

Expanding Triangle / Broadening wedgeThe price of ICP Internet Computer appears to be locked in a falling wedge on the weekly time frame, which means that the price is in a downward spiral that is tightening to the downside putting more pressure on the market and eventually a breakout will follow. On the RSI a slight positive divergence and the MACD which has been up for some time but is still below the 0 line.
on the daily time frame and here im taking the latest downtrend within the formation above which falls nicely into a downtrend channel. The EW also fits nicely into this and these readings are also respected, though I did add an alternative wave 5. Then attention to the Broadening wedge, which in the EW is sometimes called an Expanding triangle. As it looks now, the MACD seems to bend upwards and thus we create positive divergence which somewhere then fits nicely into the story of the weekly timeframe in addition to that when crossing the 0 line this can be seen as a trend change. Should the current support of the Broadening wedge break down, I expect that we can go down towards $2.50.

ICP invertedHello Birdies,
Just for fun Inverted chart for ICP and find that we still have some untested reason before any upside.
Plotted till 1.55 in the era of bloodbath that is our region to long.

Internet Computer (ICP) formed bullish BAT for upto 25.50% moveHi dear friends, hope you are well and welcome to the new trade setup of Internet Computer ( ICP ) with US Dollar pair.
Our last successful trade of ICP was as below:
On a daily time frame, ICP has formed a bullish BAT pattern.
Note: Above idea is for educational purpose only. It is advised to diversify and strictly follow the stop loss, and don't get stuck with trade

(ICP) Internet Computer EOY Price TargetsDfinity’s Internet Computer (ICP) has been featured on crypto news websites more as of recently, especially after the FTX crash. There’s been rumors that they manipulated the price action of this coin because they were scared of the public finding out about its groundbreaking technology. The truth can only stay hidden for so long, it’s only a matter of time before the masses figure it out.
In recent news on the ICP blockchain, the Internet Computer can now serve as a Layer 2 for Bitcoin where smart contracts on the Internet Computer coan hold, send and receive Bitcoin natively, without the need for blockchain bridges or other third parties. This provides a trust-less foundation or various DeFi and Web3 applications looking to code on the Bitcoin blockchain.
This is game-changing for the industry, finally brining smart contract functionality to Bitcoin and enabling a whole new landscape of DeFi and DApp development that was previously only dreamt of. The Internet Computer’s integration with Bitcoin also provides a mmore secure alternative to centralized bridges in the form of threshold ECDSA (Elliptic Curve Digital Signature Algorithm). The implementation of ECDSA empowers the Internet Computer’s canister smart contracts, to directly conduct Bitcoin transactions without an intermediary or bridge. This provides a trust-less framework for DeFi projects that wish to use Bitcoin and doubles for ICP developers to natively code on the Bitcoin blockchain.
There are now 200,000 canister smart contracts deployed on the Internet Computer. At the same time, the network is casually processing 10,000+ TX/s! This is truly an achievement showcasing the incredible ICP developer ecosystem and the scalability of the Internet Computer.
Now moving into the technical analysis side of things, looking at the 12-hour chart we can see a clear pattern of capitulation, manipulation, and accumulation. This pattern was seen from $975 on ETH in the summer and this looks eerily similar for some reason. I know Vitalik has said in a small press conference with no major media outlets that Dfinity’s Internet Computer was a sister network to the gargantuan ETH blockchain, but didn’t expect the charts to coincide like that.
Anyways, the capitulation period during the start of November was accelerated by the FTX crash & accompanying ripple effects, and then for the rest of the month we spent in manipulation underneath the major accumulation zone found from the lows formed in the summer (July capitulation event).
From here, i’m expecting continued consolidation around this accumulation region at $4.30 - $4.60 before an eventual breakout to my (2) target profit levels:
TP1 🎯 $4.99
TP2 🎯 $5.59
The first $5 level acts as this range’s EQ with the top of the EQ being TP2 @ $5.59. The accumulation zone is phenomenal for long term scooping and could potentially come out as a bottom. Although it may occur, i’m not expecting one giant candle upwards, it’s going to take some time to play out as we just 1st touch rejected off of the $4.60 level. You can zoom back in the charts and find that is the swing low from the July capitulation event. Huge level of support turned resistance that we are currently trying to breakout from.
As always please do your own research, I am not a financial advisor.

ICPI am of the opinion on the continuation of the correction. I guess it is within a final z-length.

ICP's price trend was in the low-range timeframes!During the last two weeks, ICP's price trend was in the low-range timeframes. After the last bearish wave took the price to the $3.5 support level, we could have expected a range trend with a positive reaction the next day, November 10. In the second encounter to the support of $3.5, a positive reaction has been observed again. But the resistance that prevents further price growth is considered in the range of 4 to 4.17 dollars. which has prevented price growth many times in the past few days. As you can see on the daily time frame, the price is in the upper half of the long-term descending channel, and on the other hand, the failure to break the $3.5 support could be a sign of possible upside for the medium term.
For the short-term, an ascending channel has been broken downwards in the 1-hour timeframe, which short-term upward movements can be considered a pullback. Short-term support is in the $3.60-$3.62 range, and a positive reaction is expected from this area. Therefore, if we have support in the market and the floor of $3.5 is not broken, we can expect the price to grow to $4, $4.6, and $5 targets from this range.

ICPUSD decision time - short termWhat we can see on the chart is a symmetrical triangle pattern .
Take a position only if/when the price breaks out of the triangle.
If the price breaks down, enter short.
If the price choose upside, enter long position.
Targets as shown in the chart.
P.S Don´t forget to setup stop loss :)
Good luck

RSI Higher LowLooking at #ICP and #BTC. Both assets made a lower low and if the RSI can hold strong there should be a incoming bounce for both assets in the coming weeks. But if sell pressure becomes to much we'll have to see where it goes. have Stop losses ready

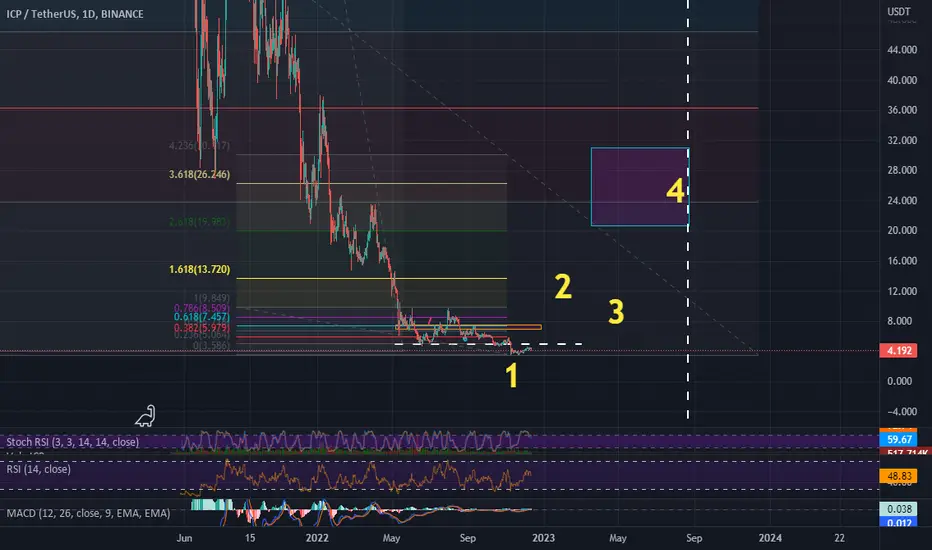
ICP Unchained?Bearish Idea
ICP looks like copying the same price action as before it did in the box labeled 1. I believe it will rise to Retest the area around 4.5-4.6. If the price got rejected from that area than we could expect more fall till to 3.5-2-1.5.
Bullish Idea
FTX was one of the main reason why ICP fell so much but beacuse of the late events, maybe it could be a chance ICP to get rid of it's chains. In that case, if it can break the upper trendline(the black one), then we could expect more rise up to 9.80.
For the both case, I think we should wait for the comformation.
Not a financial advice. I am just correcting my previous graphs.

Time For ICP?ICP looks like drawing "double buttom" formation. The project is really good but the coin continues to dissappoint people.I believe FTX is still manupilating the price. I hope it raises from its ashes.
This is not a financial advice. It is just a guess.

45% for ICP with patienceI like ICP because this coin is more than 98% down from ath and it is technicaly buy without any doubts. Very nice PA here with green engulfing bullish daily candle...there should be some small pullback = my buy area = before it will go higher... i am aiming 25-40%. GL
MANAGE YOUR RISK

ICPUSD one more drop is still possibleWhat we can see in the chart is a head and shoulders pattern.
If this pattern plays out , we will see 30 % drop
$4,20 may be a good price to buy more ICP if we get it.
Long-term we still expect $80 .
Short-term $4,20 would NOT be anything surprising.
Enter the short position only if/when the price breaks down the neckline of the head and shoulders pattern.

Bearish Scenario For ICPWe should always consider the two scenario, Bullish and Bearish, for the market. I already shared my Bullish idea about ICP with the double buttom formation. Now, let's consider the bad scenario. ICP looks like copying the same pattern which it did on May-June 2022. If the price goes down from 4$ we could expect huge dump on the price until 1.40-1.50$. Unforutenately it still could not break the ressistance trend line so we should be carefull on this coin.

ICP/USDT Local trendLocal trend (part of the secondary), clamping in the lower part of the channel (which was formed after the huge descending wedge broke down under the market dump). Logarithm graph. Timeframe 1 day.
Coin in coinmarket : Internet Computer ICP
Line chart.
Main trend
This is a wedge that was broken down after +40% growth and an unsuccessful retest (rationality under the market movements).
ICP/USD Main trend.Falling wedge
This is how the main trend looks now after the market dump. Pay attention to which zone the price is now.
Line chart. 3 days timeframe

ICP bullish scenarioThis is my view on ICP from technical perspective :
The correction from 31 th July - now is not as deep as correction on btc
Still higher low from 18th June low
The 31th July high could be an impulse wave (volume confirmed)
Any further correction below $5.2 would be a good opportunity to have spot position
Invalidation at below $4.6
(not financial advice)
