ICP/USDT Weekly Analysis: Multi-Year Accumulation Base🔍 Macro Outlook & Context:
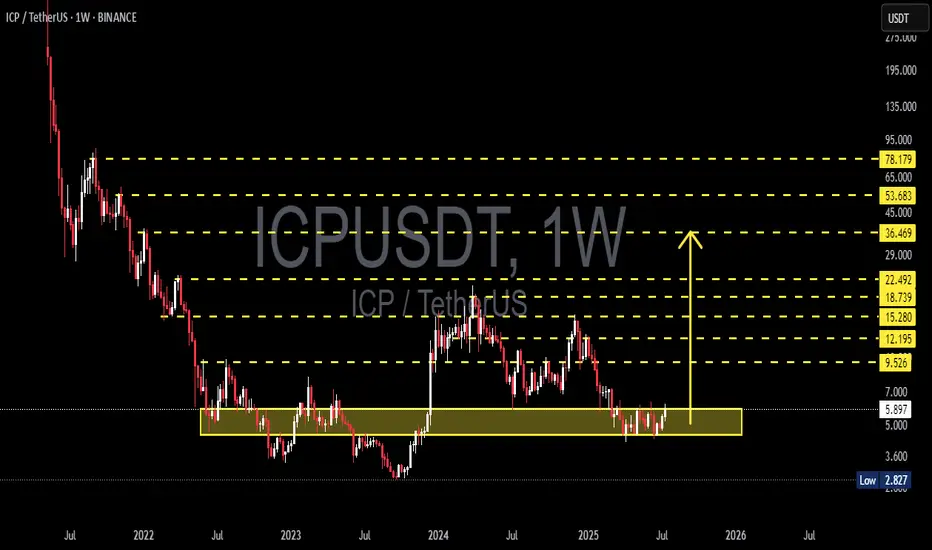
ICP has been in a prolonged downtrend since its initial listing, dropping over 95% from its all-time high. However, since late 2022, ICP has been forming a strong and well-defined accumulation base between the $3.00 – $6.00 range.
Currently, price action and structure indicate that a potential breakout from this multi-year base is imminent. The setup is beginning to mirror a Wyckoff Accumulation Phase, where smart money accumulates quietly before launching into the next markup phase.
📐 Technical Structure & Pattern Breakdown:
✅ Accumulation Zone
Over 80 weeks of consolidation within a tight horizontal range.
This forms a strong foundation for a powerful breakout move if confirmed.
✅ Multiple Bottom Formation
Repeated failures to break below $3.50 suggest growing bullish pressure and seller exhaustion.
✅ Bullish Compression
Higher lows forming inside the range.
Resistance at $6.00 is being tested more frequently, indicating a breakout buildup.
✅ Volume Profile
Declining volume during sideways action = typical of supply exhaustion.
Surge in volume during breakout would confirm entry into markup phase.
🚀 Bullish Scenario (Primary Setup):
If price breaks and closes above $6.00 on the weekly timeframe:
Key Resistance Targets:
$9.52 → $12.19 → $15.28 → $18.73 → $22.49
Extended Bull Market Targets:
$29 → $36 → $45+
Potential ROI from base zone: +200% to +600%
Bullish Confirmation Signals:
Strong weekly candle close above $6.00
Volume breakout
RSI crossing 50 and MACD bullish crossover
🐻 Bearish Scenario (Alternative):
If the breakout fails and rejection occurs at $6.00:
Possible retracement back to lower support zones:
$4.50 → $3.00
A breakdown below $3.00 would invalidate the bullish structure and open risk for new lows.
Bearish Red Flags:
Long upper wick near resistance without volume
RSI drops back under 40
Breakdown of $3.50–$4.00 support zone
📊 Trading Strategy & Risk Management:
Entry Type Price Range
Breakout Entry $6.20–$6.50
Conservative SL $5.20
Aggressive SL $4.70
TP Range $9.5 to $22.4
Long-Term TP Up to $45+
Use scaled take-profits to secure gains gradually and reduce risk.
🧠 Market Sentiment & Psychology:
Sentiment is slowly shifting from fear to anticipation. Long-term accumulators and institutional players often target setups like this — low prices with solid structure and untapped upside. If breakout confirms, ICP could become one of the top-performing altcoins of the next cycle.
> “Accumulation is where smart money buys. Breakout is where the public chases.”
📌 Final Thoughts:
ICP/USDT is at its most critical point in over two years. A confirmed breakout from this long-standing base could be the launchpad for a multi-stage rally. This is a setup worth watching closely — or acting on with tight risk control.
#ICPUSDT #CryptoBreakout #AltcoinAnalysis #TechnicalAnalysis #WyckoffAccumulation #LongTermSetup #CryptoReversal #BullishCrypto #ICPAnalysis #AltcoinSeason #BreakoutTrade #Cryptocurrency
Icpusdtanalys
ICPUSDT 1W AnalysisICP ~ 1W Analysis
#ICP If you still have confidence in this coin, maybe you can consider this support to start buying back from here, with a short-term target of at least 15%++

ICPUSDTICP ~ 1W
#ICP If you still have Conviction on this coin. Buy on this support block. this is a very good place to start buying back,. with a minimum target of 20%++

ICP → Ascending Triangle Breakout! Take Advantage of This Long.Internet Computer Token is knocking on the gates of resistance in a bullish ascending triangle pattern! It seems inevitable that the price will reach higher highs, but do we have enough data to enter a long now?
How do we trade this?
We have these key bullish data points; the macro trend, ascending triangle pattern, RSI above the Moving Average, and Bitcoin as a leading indicator reaching new highs. It may seem like longing now is a great idea, but it's risky for one very important reason; we're at resistance. There isn't enough room for reward against our risk, which is at least just below the 30EMA ribbon.
Confirmation of a breakout is necessary in this analysis. Once the price breaks out and tests prior resistance as support, it's reasonable to long. Place your protective stop just below the top of the triangle or EMA ribbons and your take profit just before the next resistance zone.
Since we're at resistance, be prepared for the market to reverse and trade accordingly!
Trade Idea
Long Entry : $5.20
Stop Loss: $4.24
Take Profit: $6.60
Risk/Reward Ratio: 1:2.5
Key Takeaways
1. Ascending Triangle, Bias to Long!
2. Macro Trend is Bullish
3. Wait for Resistance to Break before longing.
4. RSI at 60.00 and above Moving Average, Supports Long.
5. After breaking Resistance, Long after test of Support.
You are solely responsible for your trades, trade at your own risk!
If you found this analysis helpful, click the Boost button and let us know what you think in the comment section below!

ICPUSDTA little counter trend trade on ICPUSDT, I call this setup *No man's land* cause it always plays out well. Am expecting a drop.

ICP/USDT DAILY TF UPDATE
Hi guys, This is CryptoMojo, One of the most active trading view authors and fastest-growing communities.
Do consider following me for the latest updates and Long /Short calls on almost every exchange.
I post short mid and long-term trade setups too.
Let’s get to the chart!
I have tried my best to bring the best possible outcome in this chart, Do not consider it as financial advice.
Welcome to this ICP/USDT TRADE setup. ICP looks great here.
Breaking out from the falling wedge in the daily time frame. It also breaks 21ma.
Also, making a big bullish divergence in the daily time frame. Buy some now and add more in dips.
Entry range:- $16.4-$17.4
Target1:- $20.2
Target2:- $23.6
Target3:- $27.4
Target4:- $30.2
SL:- $15
Use low leverage (2x-4x)
This chart is likely to help you in making better trade decisions, if it did do consider upvoting this chart.
Would also love to know your charts and views in the comment section.
Thank you

ICPUSDt analysHello friends.
Please support my work by clicking the LIKE button(If you liked).Thank you!
Everything on the chart.
Cup and hundle pattern.
open pos: market
target: 90 and 100
after first target reached move ur stop to breakeven
stop: ~58 (depending of ur risk). ALWAYS follow ur RM .
risk/reward 1 to 5
Good luck everyone!
Follow me on TRADING View, if you don't want to miss my next analysis or signals.
It's not financial advice.
Dont Forget, always make your own research before to trade my ideas!
Open to your questions or suggestions(Looking for investors!).
