EURUSD: The Market Is Looking Up! Long!
My dear friends,
Today we will analyse EURUSD together☺️
The market is at an inflection zone and price has now reached an area around 1.17341 where previous reversals or breakouts have occurred.And a price reaction that we are seeing on multiple timeframes here could signal the next move up so we can enter on confirmation, and target the next key level of 1.17512.Stop-loss is recommended beyond the inflection zone.
❤️Sending you lots of Love and Hugs❤️
Ict

GOLD: Strong Bullish Sentiment! Long!
My dear friends,
Today we will analyse GOLD together☺️
The price is near a wide key level
and the pair is approaching a significant decision level of 3,317.31 Therefore, a strong bullish reaction here could determine the next move up.We will watch for a confirmation candle, and then target the next key level of 3,309.44.Recommend Stop-loss is beyond the current level.
❤️Sending you lots of Love and Hugs❤️

DXY: Bears Are Winning! Short!
My dear friends,
Today we will analyse DXY together☺️
The recent price action suggests a shift in mid-term momentum. A break below the current local range around 96.860 will confirm the new direction downwards with the target being the next key level of 96.760.and a reconvened placement of a stop-loss beyond the range.
❤️Sending you lots of Love and Hugs❤️

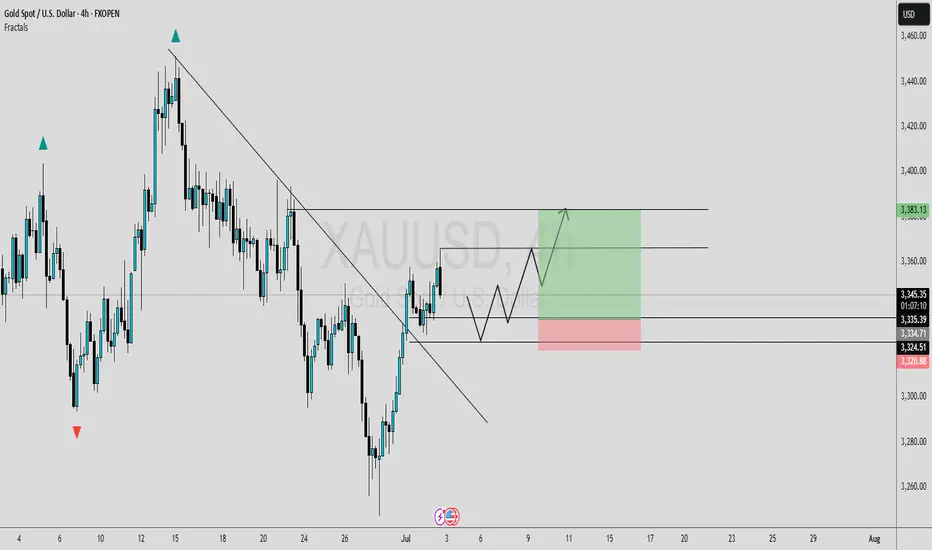
TRENDLINE BREAKOUT [LONG]In this analysis we're focusing on 4H timeframe. As we know that price move impulse toward upside and break trendline, now I'm waiting for retracement. Once price reach my zone and give any type of bullish confirmation than we'll execute our trade. This is a higher time frame analysis and key levels. Let's analyze more deeply into smaller time frame and potential outcomes.
Always use stoploss for your trade.
Always use proper money management and proper risk to reward ratio.
#XAUUSD 4H Technical Analysis Expected Move.

Framing a scalp.. ICT style.. The R2F way..In this short video I go through how I personally frame a trade using ICT concepts. We have the opportunity to see it pan out pretty quickly, which is always a nice thing.
- R2F Trading

GOLD Short From Resistance! Sell!
Hello,Traders!
GOLD is weaker than we
Expected and failed to break
The key horizontal level
Around 3360$ and we are
Now seeing a bearish rejection
So we are locally bearish biased
And we will be expecting a
Further bearish move down
Sell!
Comment and subscribe to help us grow!
Check out other forecasts below too!
Disclosure: I am part of Trade Nation's Influencer program and receive a monthly fee for using their TradingView charts in my analysis.

AUD_USD WILL GO UP|LONG|
✅AUD_USD has retested a key support level of 0.6540
And as the pair is already making a bullish rebound
A move up to retest the supply level above at 0.6584 is likely
LONG🚀
✅Like and subscribe to never miss a new idea!✅
Disclosure: I am part of Trade Nation's Influencer program and receive a monthly fee for using their TradingView charts in my analysis.

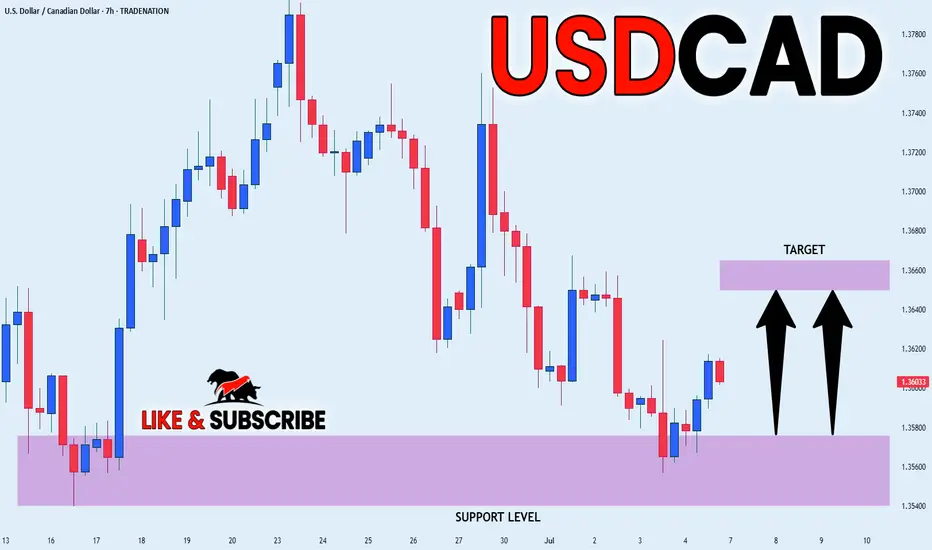
USD_CAD POTENTIAL LONG|
✅USD_CAD went down to retest
A horizontal support of 1.3560
Which makes me locally bullish biased
And I think that a move up
From the level is to be expected
Towards the target above at 1.3652
LONG🚀
✅Like and subscribe to never miss a new idea!✅
Disclosure: I am part of Trade Nation's Influencer program and receive a monthly fee for using their TradingView charts in my analysis.
EUR-AUD Will Fall! Sell!
Hello,Traders!
EUR-AUD keeps trading in
A strong uptrend and the pair
Is locally overbought so as the
Pair is retesting a horizontal
Resistance of 1.8019 from
Where we will be expecting
A local pullback on Monday
Sell!
Comment and subscribe to help us grow!
Check out other forecasts below too!
Disclosure: I am part of Trade Nation's Influencer program and receive a monthly fee for using their TradingView charts in my analysis.

EUR-NZD Risky Short! Sell!
Hello,Traders!
EUR-NZD made a retest
Of the local horizontal resistance
Of 1.9485 so despite the uptrend
We are locally bearish biased
And we will be expecting a
Local bearish correction
On Monday
Sell!
Comment and subscribe to help us grow!
Check out other forecasts below too!
Disclosure: I am part of Trade Nation's Influencer program and receive a monthly fee for using their TradingView charts in my analysis.

CAD_CHF GROWTH AHEAD|LONG|
✅CAD_CHF made a retest
Of the horizontal support
Of 0.5820 and we are already
Seeing a bullish reaction
So we will be expecting a
Further bullish move up
On Monday
LONG🚀
✅Like and subscribe to never miss a new idea!✅
Disclosure: I am part of Trade Nation's Influencer program and receive a monthly fee for using their TradingView charts in my analysis.

EUR/USD – Smart Money Trap at 1.18? Massive Rejection Ahead 1. Technical Context
The pair has been moving inside a well-defined bullish channel since May, forming higher highs and higher lows. Price is currently hovering around 1.1718, approaching the upper boundary of the channel and a key weekly supply zone (1.1750–1.1850).
➡️ Potential scenario:
A short bullish extension toward 1.1780–1.1820 to trigger stop hunts, followed by a bearish rejection toward 1.1500, and potentially 1.1380.
The daily RSI is overbought (>70), suggesting a likely short-term correction.
2. Retail Sentiment
80% of retail traders are short, with an average entry around 1.1318.
This signals a liquidity cluster above current highs, increasing the likelihood of a fake bullish breakout followed by a sell-off.
➡️ Contrarian insight: Retail heavily short → market may push higher first to wipe them out before reversing lower.
3. COT Report – USD Index (DXY)
Non-commercials (speculators) increased their short exposure on USD (+3,134).
Commercials cut their short positions (-1,994), indicating a potential bottoming on the dollar.
➡️ Conclusion: USD strength could return soon → bearish pressure for EUR/USD.
4. COT Report – EUR FX
Non-commercials increased longs on EUR (+2,980) and sharply reduced shorts (-6,602) → market is now heavily net long.
Commercials remain net short (581,664 vs 417,363 longs).
➡️ Over-leveraged spec longs → vulnerable to downside squeeze if macro sentiment shifts.
5. Seasonality
June tends to be mildly bullish for EUR/USD.
July historically shows even stronger upward performance over the last 5–10 years.
➡️ Shorts are high risk in the very short term, but a bearish setup is likely in the second half of July, especially if price action confirms.
6. Trading Outlook
📍 Short-Term Bias: Neutral to bullish toward 1.1780–1.1820
📍 Mid-Term Bias: Bearish on rejection from supply area and break of channel
🎯 Key Levels:
1.1780–1.1850: critical decision zone (liquidity + weekly supply)
1.1500: first key support
1.1380: next downside target (demand zone + previous POC)
📌 Final Conclusion
The most likely play is a short setup from 1.1780–1.1850 on strong rejection, supported by:
Extreme retail positioning (80% short),
COT pointing to USD recovery,
Extended technical structure,
Overbought RSI on the daily chart.

ETHUSD: Next Move Is Down! Short!
My dear friends,
Today we will analyse ETHUSD together☺️
The in-trend continuation seems likely as the current long-term trend appears to be strong, and price is holding below a key level of 2,514.4 So a bearish continuation seems plausible, targeting the next low. We should enter on confirmation, and place a stop-loss beyond the recent swing level.
❤️Sending you lots of Love and Hugs❤️

BTCUSD: Target Is Up! Long!
My dear friends,
Today we will analyse BTCUSD together☺️
The market is at an inflection zone and price has now reached an area around 108,067 where previous reversals or breakouts have occurred.And a price reaction that we are seeing on multiple timeframes here could signal the next move up so we can enter on confirmation, and target the next key level of 108,140. Stop-loss is recommended beyond the inflection zone.
❤️Sending you lots of Love and Hugs❤️

AUD-NZD Local Long! Buy!
Hello,Traders!
AUD-NZD is already making
A bullish rebound from the
Horizontal support of 1.0810
So we are locally bullish biased
And we will be expecting a
Further bullish move up
Buy!
Comment and subscribe to help us grow!
Check out other forecasts below too!
Disclosure: I am part of Trade Nation's Influencer program and receive a monthly fee for using their TradingView charts in my analysis.

GBP_AUD BEARISH BIAS|SHORT|
✅GBP_AUD is going up to retest
A horizontal resistance of 2.0892
Which makes me locally bearish biased
And I think that we will see a pullback
And a move down from the level
Towards the target below at 2.0805
SHORT🔥
✅Like and subscribe to never miss a new idea!✅
Disclosure: I am part of Trade Nation's Influencer program and receive a monthly fee for using their TradingView charts in my analysis.

GBP/CHF Headed to 1.10 – But Bulls Might Regret It📉 1. Price Action & Technical Structure (D1)
Key demand zone tested with bullish reaction:
Price reacted strongly around the 1.0790–1.0840 structural demand area, previously the origin of a significant bullish impulse. The latest daily candle closed above the previous swing low, suggesting a potential technical rebound.
Immediate target:
The 1.0980–1.1010 zone, aligning with:
A clear supply area
RSI bouncing from oversold territory
A visible imbalance left unfilled
Technical bias: Short-term LONG to fill the imbalance before a potential institutional-driven short setup at supply.
2. Retail Sentiment
86% of traders are LONG, with an average entry of 1.0997
Only 14% are SHORT, with lower volume and better pricing
Current price: 1.0833, meaning most long traders are in drawdown
Contrarian view:
The heavy long positioning creates a liquidity pool between 1.0990–1.1010, making that zone highly attractive for institutional distribution and liquidation of retail longs, especially if accompanied by a structural shift.
🎯 Operational impact:
Supports a technical long to 1.10, but high risk of reversal once that level is reached.
3. COT Report
GBP (British Pound – CME)
Non-commercials:
Long: -6,434 → massive unwind of bullish exposure
Short: +2,028 → rising bearish bets
Net positioning is increasingly bearish
Commercials:
Long: +7,459 → increasing coverage against GBP weakness
Short: -569 → slight reduction
Positioning is mixed, but commercials are taking defensive long positions
GBP interpretation:
Bearish pressure rising from institutional speculators, despite some commercial support.
CHF (Swiss Franc – CME)
Non-commercials:
Long: +327
Short: +1,215
Net positioning still heavily short, but shorts increasing again
Commercials:
Long: +1,909
Short: +307
Commercials are accumulating long CHF positions (bullish sign)
CHF interpretation:
Divergence between commercials (bullish CHF) and speculators (still short) → shift may be underway.
4. July Seasonality
GBP:
Historically strong in July, especially the last 2 years (+3.5%)
Positive tendency across 10y/15y/20y averages
CHF:
Also seasonally positive in July, but underperforms GBP across most timeframes (except 2Y where CHF is also strong)
Operational impact:
Favors short-term bullish GBP/CHF bias, supported by seasonal momentum.
✅ Final Outlook
Current short-term bias is bullish, driven by:
Clear technical rebound
Visible imbalance toward 1.10
Seasonal divergence in favor of GBP
However, excessive retail long positioning + COT speculative pressure on GBP suggest this rally could be a distribution phase, offering an optimal short opportunity at 1.10.

EUR_AUD LOCAL CORRECTION|SHORT|
✅EUR_AUD is set to retest a
Strong resistance level above at 1.8020
After trading in a local uptrend for some time
Which makes a bearish pullback a likely scenario
With the target being a local support below at 1.7940
SHORT🔥
✅Like and subscribe to never miss a new idea!✅
Disclosure: I am part of Trade Nation's Influencer program and receive a monthly fee for using their TradingView charts in my analysis.

EUR-GBP Will Grow! Buy!
Hello,Traders!
EUR-GBP keeps trading in
A strong uptrend and the
Pair made a retest and a
Rebound from the horizontal
Support level around 0.8621
So we are bullish biased and
We will be expecting a
Further bullish move up
Buy!
Comment and subscribe to help us grow!
Check out other forecasts below too!
Disclosure: I am part of Trade Nation's Influencer program and receive a monthly fee for using their TradingView charts in my analysis.

SILVER RESISTANCE AHEAD|SHORT|
✅SILVER has been growing recently
And the pair seems locally overbought
So as the pair is approaching a
Horizontal resistance of 3730$
Price decline is to be expected
SHORT🔥
✅Like and subscribe to never miss a new idea!✅
Disclosure: I am part of Trade Nation's Influencer program and receive a monthly fee for using their TradingView charts in my analysis.

NG1!: Move Up Expected! Long!
My dear friends,
Today we will analyse NG1! together☺️
The price is near a wide key level
and the pair is approaching a significant decision level of 3.403 Therefore, a strong bullish reaction here could determine the next move up.We will watch for a confirmation candle, and then target the next key level of 3.429.Recommend Stop-loss is beyond the current level.
❤️Sending you lots of Love and Hugs❤️

USOIL: Local Bearish Bias! Short!
My dear friends,
Today we will analyse USOIL together☺️
The recent price action suggests a shift in mid-term momentum. A break below the current local range around 66.47 will confirm the new direction downwards with the target being the next key level of 66.19.and a reconvened placement of a stop-loss beyond the range.
❤️Sending you lots of Love and Hugs❤️
