XAUUSD (Upcoming Plan with 2 Scenarios) Analysis for the upcoming week (InShaaAllah) (2 Scenarios)
Breaking: Trump says tariff letters to 12 countries signed, going out Monday...
Ict
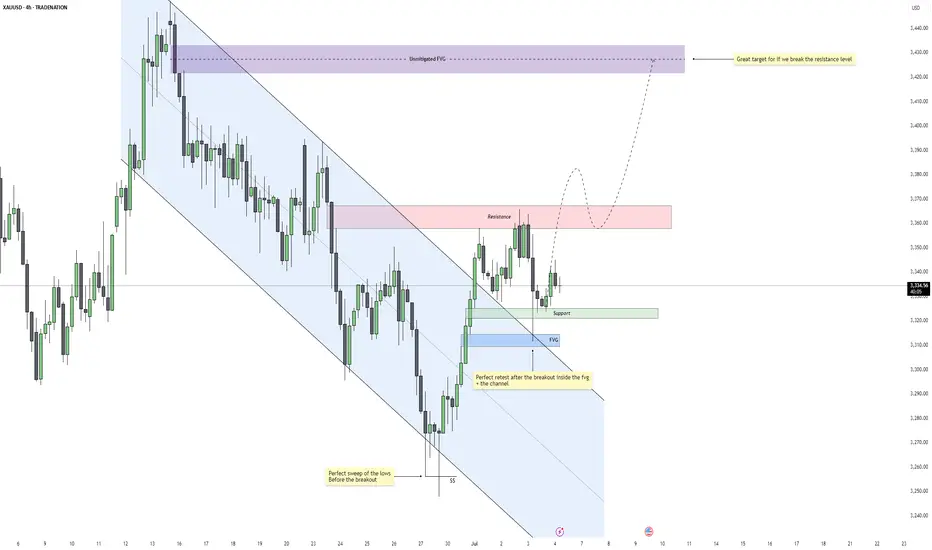
Gold – Is $3430 the Next Target After This Breakout?Gold recently completed a clean sweep of the 4H swing lows, taking out downside liquidity just before breaking out of a well-defined descending channel. This move marked a shift in momentum and structure, suggesting that the bearish leg may have concluded and the market is now transitioning into a more bullish phase.
Breakout Confirmation and Retest Zone
Following the breakout, price retraced and tapped directly into a confluence area where a fair value gap aligns with the upper boundary of the broken channel. This acted as a high-probability retest zone, and the reaction was strong. The market respected this structure perfectly, adding conviction to the breakout's validity.
Support and Resistance Dynamics
Currently, price is hovering between a nearby support level and a short-term resistance zone above. The support is holding firm after the retest, while the resistance is capping upward momentum for now. This is a healthy consolidation following the breakout, and it provides a clear structure for monitoring continuation.
Imbalance Target and Flow Outlook
Should the market gain enough strength to break through the overhead resistance, there is a large unmitigated imbalance further above that stands as a strong magnet. It represents a clean fair value gap left behind during the previous selloff and could be the next major draw if bullish momentum continues.
Overall Flow and Trade Logic
The sequence is very clean: sweep of liquidity, bullish breakout, efficient retest, and now consolidation above support. As long as price continues to form higher lows and respect the current structure, the probability of further upside remains favorable. Patience around the resistance area will be key for confirmation.
Conclusion
Gold is displaying a textbook reversal setup driven by liquidity and structure. If the current support continues to hold and buyers reclaim control above resistance, the path toward the upper imbalance becomes highly probable. The market is aligned for continuation, with bullish momentum building gradually.
Disclosure: I am part of Trade Nation's Influencer program and receive a monthly fee for using their TradingView charts in my analysis.
___________________________________
Thanks for your support!
If you found this idea helpful or learned something new, drop a like 👍 and leave a comment, I’d love to hear your thoughts! 🚀
CAD-CHF Local Long! Buy!
Hello,Traders!
CAD-CHF made a retest
Of the horizontal support
Of 0.5832 so we are locally
Bullish biased and we will be
Expecting a local bullish move up
Buy!
Comment and subscribe to help us grow!
Check out other forecasts below too!
Disclosure: I am part of Trade Nation's Influencer program and receive a monthly fee for using their TradingView charts in my analysis.

Bitcoin's 4-year bullish cycle is coming to an end.The price reversal and manipulation zone could be between $120K and $133K, indicating a big bearish movement.
Quarterly analysis indicates a target of approximately $24,750.
QT + ICT + SMC
- Sainty

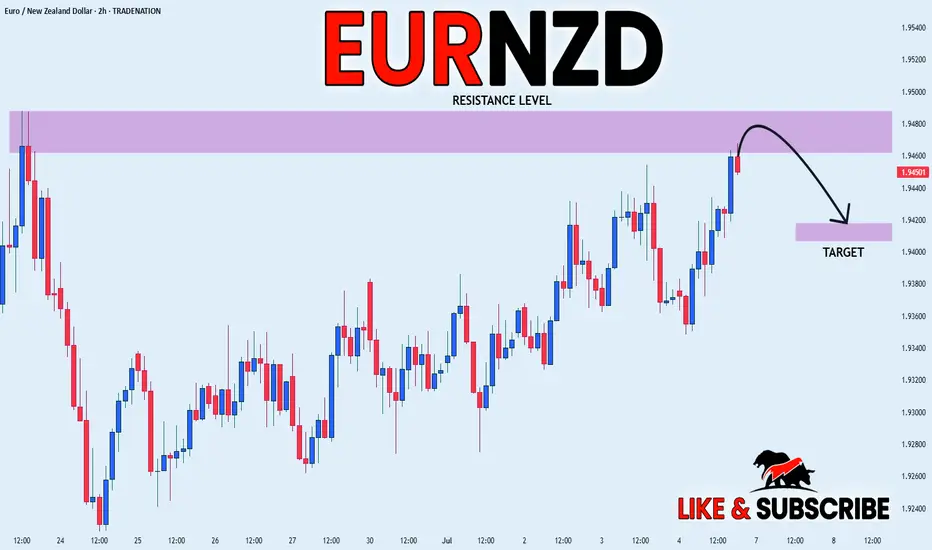
EUR_NZD LOCAL SHORT|
✅EUR_NZD is set to retest a
Strong resistance level above at 1.9488
After trading in a local uptrend for some time
Which makes a bearish pullback a likely scenario
With the target being a local support below at 1.9420
SHORT🔥
✅Like and subscribe to never miss a new idea!✅
Disclosure: I am part of Trade Nation's Influencer program and receive a monthly fee for using their TradingView charts in my analysis.
USD-CAD Local Rebound! Buy!
Hello,Traders!
USD-CAD is trading in a
Strong downtrend but
The pair made a retest
Of the horizontal support
Level of 1.3540 from where
We are already seeing a
Bullish rebound and we
Will be expecting a
Further move up
Buy!
Comment and subscribe to help us grow!
Check out other forecasts below too!
Disclosure: I am part of Trade Nation's Influencer program and receive a monthly fee for using their TradingView charts in my analysis.

Bitcoin – ATH Sweep or Breakout?Bitcoin is pushing into a critical decision point as it challenges the previous all-time high near 110k. After a strong push out of a rounded bottom formation with clean higher lows, price has now broken above the last visible resistance area and is hovering just under the ATH liquidity. This rally has been aggressive, but the reaction here will determine whether this move becomes an extended breakout or a classic trap.
Liquidity and Key Resistance
The ATH zone around 110k carries a large pool of liquidity, and price is now testing it for the first time since the breakout. We’ve already had a clean break above the prior resistance zone, but we haven’t yet seen a confirmed close above ATH with convincing volume. If price manages to close strongly above this level on the 4H or daily chart, that would be a sign that bulls are in full control. Until then, the possibility of a sweep and rejection remains firmly on the table.
Sweep Scenario and Downside Levels
If we fail to close convincingly above the ATH and instead see a wick through followed by a strong reversal, that would confirm the sweep. In that case, I’d expect short setups to activate quickly, with downside targets sitting around 105k. This level marks the structure support below the most recent breakout, and would be a logical point for price to rebalance before continuing any broader uptrend. A rejection from current levels would also trap late longs and provide fuel for a quick retracement.
Bullish Breakout Scenario
If we do get that proper breakout above 110k, backed by strong volume and continuation candles, the upside opens fast. There’s very little structure above the ATH, so price could move cleanly up into the next round psychological target around 115k. This move would confirm continuation of the higher timeframe trend and offer short-term breakout retests for potential long re-entries.
Volume and Candle Confirmation Are Crucial
At this stage, the setup is binary and all about confirmation. A clean 4H or daily close above ATH with follow-through volume will flip the bias fully bullish. But if we get signs of exhaustion and a failed breakout attempt, the sweep setup becomes highly probable. Waiting for confirmation here is key, rather than trying to front-run the move.
Conclusion
Bitcoin is sitting right at a high-stakes level. We either continue into price discovery toward 115k if momentum follows through, or we see a classic liquidity sweep and rejection back into 105k. The clean structure and recent higher lows support both sides of the argument, but execution will depend on how price reacts around the ATH. Either way, this zone is the key pivot for the next major swing.
Disclosure: I am part of Trade Nation's Influencer program and receive a monthly fee for using their TradingView charts in my analysis.
___________________________________
Thanks for your support!
If you found this idea helpful or learned something new, drop a like 👍 and leave a comment, I’d love to hear your thoughts! 🚀

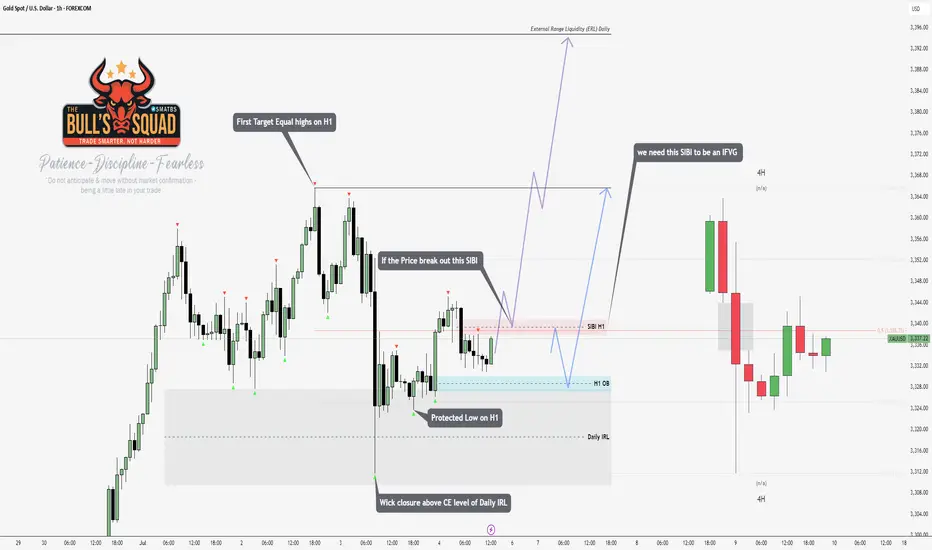
Gold HFTHTF trade using fib 0.5 respected + Dealing range on the LTF
waiting for retracement didn't happen gold is stronger today so the best is to look at HTF nice SIBI waiting for the purg targeting SSLQ be carfull 4th of july so market will close early and maybe we don't reach our target so take profit maybe we gonna face reversal so too risky

US30: Will Go Up! Long!
My dear friends,
Today we will analyse US30 together☺️
The market is at an inflection zone and price has now reached an area around 44,585.50 where previous reversals or breakouts have occurred.And a price reaction that we are seeing on multiple timeframes here could signal the next move up so we can enter on confirmation, and target the next key level of 44,663.28.Stop-loss is recommended beyond the inflection zone.
❤️Sending you lots of Love and Hugs❤️

SILVER: The Market Is Looking Up! Long!
My dear friends,
Today we will analyse SILVER together☺️
The price is near a wide key level
and the pair is approaching a significant decision level of 36.830 Therefore, a strong bullish reaction here could determine the next move up.We will watch for a confirmation candle, and then target the next key level 36.903.Recommend Stop-loss is beyond the current level.
❤️Sending you lots of Love and Hugs❤️

EURUSD: Strong Bearish Sentiment! Short!
My dear friends,
Today we will analyse EURUSD together☺️
The recent price action suggests a shift in mid-term momentum. A break below the current local range around 1.17775 will confirm the new direction downwards with the target being the next key level of 1.17696.and a reconvened placement of a stop-loss beyond the range.
❤️Sending you lots of Love and Hugs❤️

GOLD: Bears Are Winning! Short!
My dear friends,
Today we will analyse GOLD together☺️
The in-trend continuation seems likely as the current long-term trend appears to be strong, and price is holding below a key level of 3,336.61 So a bearish continuation seems plausible, targeting the next low. We should enter on confirmation, and place a stop-loss beyond the recent swing level.
❤️Sending you lots of Love and Hugs❤️

US30 SHORT FROM RESISTANCE|
✅DOW JONES is going up now
But a strong resistance level is ahead at 45,077
Thus I am expecting a pullback
And a move down towards the target of 44,500
SHORT🔥
✅Like and subscribe to never miss a new idea!✅
Disclosure: I am part of Trade Nation's Influencer program and receive a monthly fee for using their TradingView charts in my analysis.

EUR-JPY Will Keep Growing! Buy!
Hello,Traders!
EUR-JPY is trading in an
Uptrend and the pair broke
The key horizontal level
Of 169.814 and the breakout
Is confirmed so after a potential
Retest of the support cluster
Of the rising and horizontal
Support lines below we will
Be expecting a bullish continuation
Buy!
Comment and subscribe to help us grow!
Check out other forecasts below too!
Disclosure: I am part of Trade Nation's Influencer program and receive a monthly fee for using their TradingView charts in my analysis.

AUD_JPY RISKY SHORT|
✅AUD_JPY is set to retest a
Strong resistance level above at 95.600
After trading in a local uptrend for some time
Which makes a bearish pullback a likely scenario
With the target being a local support below at 95.081
SHORT🔥
✅Like and subscribe to never miss a new idea!✅
Disclosure: I am part of Trade Nation's Influencer program and receive a monthly fee for using their TradingView charts in my analysis.

SILVER Short From Resistance! Sell!
Hello,Traders!
SILVER is trading in an
Uptrend but the price will
Soon hit a horizontal resistance
Area around 37,32$ from
Where we will be expecting
A local bearish correction
Sell!
Comment and subscribe to help us grow!
Check out other forecasts below too!
Disclosure: I am part of Trade Nation's Influencer program and receive a monthly fee for using their TradingView charts in my analysis.

GBP_CAD BEARISH BREAKOUT|SHORT|
✅GBP_CAD broke the key structure level of 1.8580
While trading in an local downtrend
Which makes me bearish
And as the retest of the level is complete
Bearish continuation will follow
SHORT🔥
✅Like and subscribe to never miss a new idea!✅
Disclosure: I am part of Trade Nation's Influencer program and receive a monthly fee for using their TradingView charts in my analysis.

EUR-AUD Bearish Breakout! Sell!
Hello,Traders!
EUR-AUD was trading along
The rising support line but
Now we are seeing a bearish
Breakout so we are bearish
Biased and we will be expecting
A further bearish move down
Sell!
Comment and subscribe to help us grow!
Check out other forecasts below too!
Disclosure: I am part of Trade Nation's Influencer program and receive a monthly fee for using their TradingView charts in my analysis.

EURUSD – Bearish Reversal Confirmed After Structural BreakEURUSD has shifted out of its bullish environment after a sustained rally inside a clean ascending channel. Price recently rejected a resistance zone that capped previous buying pressure and has now started to rotate downward. This marks the first serious challenge to the trend and sets the tone for a potential bearish phase.
Channel Breakdown and Price Behavior
The ascending channel had been respected for several sessions, guiding price upward with consistent higher highs and higher lows. The recent breakdown from this structure is significant, as it shows the market is no longer willing to support higher prices within that controlled environment. This type of breakout often signals a loss of momentum and increased volatility in the opposite direction.
Break of the Low and Shift in Structure
After breaking the channel, price also took out a major internal low, which had previously held during retracements. This is a key signal of a structural shift, confirming that the uptrend has been interrupted. When price breaks a low that buyers had been defending, it shows sellers have stepped in with conviction and are likely aiming lower targets.
Short-Term Target and Reaction Zone
The first area of interest sits just below current price where a support shelf and price inefficiencies line up. This zone, marked with the dollar sign symbol on the chart, may attract a short-term reaction. If buyers are still present, this is where they would likely try to step in. However, the rejection from resistance and the structural break suggest this level could eventually give way.
Imbalance Zone Below and Liquidity Target
If that support fails, the next high-probability draw is the large untested imbalance sitting further below. This zone has remained untouched since the rally began and represents unfinished business for the market. Price often seeks out these inefficiencies, especially after trend shifts, making it a natural target for sellers if momentum continues.
Conclusion
EURUSD is showing clear signs of bearish pressure after rejecting resistance, breaking structure, and leaving behind unmitigated downside targets. As long as we remain below the broken low, the path of least resistance points lower. The imbalance zone below remains the key destination unless the market shows signs of reversal higher.
Disclosure: I am part of Trade Nation's Influencer program and receive a monthly fee for using their TradingView charts in my analysis.
___________________________________
Thanks for your support!
If you found this idea helpful or learned something new, drop a like 👍 and leave a comment, I’d love to hear your thoughts! 🚀

TRBUSDT Setup – Staggered Exits, Smart Profits📌 Entry: 36.70
🎯 TP1: +10% → Secure 50% of position
🛡️ Move to risk-free after TP1 to protect capital
🎯 TP2: Take 50% of remaining volume
🎯 TP3: Close all remaining volume
Calculated exits. Risk-managed. Momentum-ready.

DXY: Next Move Is Down! Short!
My dear friends,
Today we will analyse DXY together☺️
The market is at an inflection zone and price has now reached an area around 96.362 where previous reversals or breakouts have occurred.And a price reaction that we are seeing on multiple timeframes here could signal the next move down so we can enter on confirmation, and target the next key level of 96.319..Stop-loss is recommended beyond the inflection zone.
❤️Sending you lots of Love and Hugs❤️

GOLD: Target Is Up! Long!
My dear friends,
Today we will analyse GOLD together☺️
The price is near a wide key level
and the pair is approaching a significant decision level of 3,347.31 Therefore, a strong bullish reaction here could determine the next move up.We will watch for a confirmation candle, and then target the next key level of 3,353,67.Recommend Stop-loss is beyond the current level.
❤️Sending you lots of Love and Hugs❤️

EURUSD: Move Up Expected! Long!
My dear friends,
Today we will analyse EURUSD together☺️
The recent price action suggests a shift in mid-term momentum. A break above the current local range around 1.17930v will confirm the new direction upwards with the target being the next key level of 1.17985 and a reconvened placement of a stop-loss beyond the range.
❤️Sending you lots of Love and Hugs❤️
