GOLD SUPPORT AHEAD|LONG|
✅GOLD is trading in an uptrend
With the price set to retest
The rising support line
From where I think the growth will continue
LONG🚀
✅Like and subscribe to never miss a new idea!✅
Disclosure: I am part of Trade Nation's Influencer program and receive a monthly fee for using their TradingView charts in my analysis.
Ict

USDCAD SHORT IDEA- USDCAD Is EXTREMELY WEAK AND READY FOR SELLOANDA:USDCAD USDCAD Is extremely weak I expect price to drop hard from here.
TRADE BREAKDOWN
Weekly Trend is Bearish.
Daily Trend is Bearish.
4H Trend is also Bearish.
This is 100% a trend following strategy trade.
The entry is taken on 4H time frame targeting the recent weekly swing low.
This is a 4RR Trade.

GBP_JPY RISING SUPPORT|LONG|
✅GBP_JPY is trading along the rising support
And as the pair will soon retest it
I am expecting the price to go up
To retest the supply levels above at 195.733
LONG🚀
✅Like and subscribe to never miss a new idea!✅
Disclosure: I am part of Trade Nation's Influencer program and receive a monthly fee for using their TradingView charts in my analysis.

GBP-CHF Support Ahead! Buy!
Hello,Traders!
GBP-CHF keeps falling but
A strong horizontal support
Level is ahead at 1.0921
From where we will be
Expecting a rebound
And a local bullish move up
Buy!
Comment and subscribe to help us grow!
Check out other forecasts below too!
Disclosure: I am part of Trade Nation's Influencer program and receive a monthly fee for using their TradingView charts in my analysis.

DAX: Local Bearish Bias! Short!
My dear friends,
Today we will analyse DAX together☺️
The recent price action suggests a shift in mid-term momentum. A break below the current local range around 23,509.95 will confirm the new direction downwards with the target being the next key level of 23,389.15.and a reconvened placement of a stop-loss beyond the range.
❤️Sending you lots of Love and Hugs❤️

GOLD: Absolute Price Collapse Ahead! Short!
My dear friends,
Today we will analyse GOLD together☺️
The in-trend continuation seems likely as the current long-term trend appears to be strong, and price is holding below a key level of 3,394.60 So a bearish continuation seems plausible, targeting the next low. We should enter on confirmation, and place a stop-loss beyond the recent swing level.
❤️Sending you lots of Love and Hugs❤️

EURUSD: Will Go Up! Long!
My dear friends,
Today we will analyse EURUSD together☺️
The market is at an inflection zone and price has now reached an area around 1.15524 where previous reversals or breakouts have occurred.And a price reaction that we are seeing on multiple timeframes here could signal the next move up so we can enter on confirmation, and target the next key level of 1.15663.Stop-loss is recommended beyond the inflection zone.
❤️Sending you lots of Love and Hugs❤️

SILVER: The Market Is Looking Up! Long!
My dear friends,
Today we will analyse SILVER together☺️
The price is near a wide key level
and the pair is approaching a significant decision level of 36.903 Therefore, a strong bullish reaction here could determine the next move up.We will watch for a confirmation candle, and then target the next key level of 37.240 .Recommend Stop-loss is beyond the current level.
❤️Sending you lots of Love and Hugs❤️

Nasdaq Seek and Destroy. Play Patience Game.Patience.
both bullish and bearish idea are valid.
We're ahead of FOMC of tomorrow and we might get false movements / remain under range.
better to no try to rationalize the market here but rather let it showcase his will first.

GBP_CAD RISKY LONG|
✅GBP_CAD is set to retest a
Strong support level below at 1.8380
After trading in a local downtrend for some time
Which makes a bullish rebound a likely scenario
With the target being a local resistance above at 1.8426
LONG🚀
✅Like and subscribe to never miss a new idea!✅
Disclosure: I am part of Trade Nation's Influencer program and receive a monthly fee for using their TradingView charts in my analysis.

GBP-NZD Rising Support Ahead! Buy!
Hello,Traders!
GBP-NZD keeps falling
Down but a rising support
Line is ahead and as the
Pair is locally oversold we
Will be expecting a rebound
And a move up after the
Retest of the support below
Sell!
Comment and subscribe to help us grow!
Check out other forecasts below too!
Disclosure: I am part of Trade Nation's Influencer program and receive a monthly fee for using their TradingView charts in my analysis.

USD-CHF Bearish Bias! Sell!
Hello,Traders!
USD-CHF is trading in a
Downtrend and the pair
Is making a local bullish
Pullback but will soon
Hit a horizontal resistance
Level around 0.8185
So we are bearish biased
And we will be expecting
A further bearish move down
Sell!
Comment and subscribe to help us grow!
Check out other forecasts below too!
Disclosure: I am part of Trade Nation's Influencer program and receive a monthly fee for using their TradingView charts in my analysis.

EUR-CHF Resistance Ahead! Sell!
Hello,Traders!
EUR-CHF keeps growing
But a strong horizontal
Resistance of 0.9445
Is ahead so after the
Retest we will be expecting
A local bearish move down
Sell!
Comment and subscribe to help us grow!
Check out other forecasts below too!
Disclosure: I am part of Trade Nation's Influencer program and receive a monthly fee for using their TradingView charts in my analysis.

US30: Strong Growth Ahead! Long!
My dear friends,
Today we will analyse US30 together☺️
The recent price action suggests a shift in mid-term momentum. A break above the current local range around 42,682.9 will confirm the new direction upwards with the target being the next key level of 42,855.1 and a reconvened placement of a stop-loss beyond the range.
❤️Sending you lots of Love and Hugs❤️

SILVER: Will Go Down! Short!
My dear friends,
Today we will analyse SILVER together☺️
The in-trend continuation seems likely as the current long-term trend appears to be strong, and price is holding below a key level of 36.344 So a bearish continuation seems plausible, targeting the next low. We should enter on confirmation, and place a stop-loss beyond the recent swing level.
❤️Sending you lots of Love and Hugs❤️

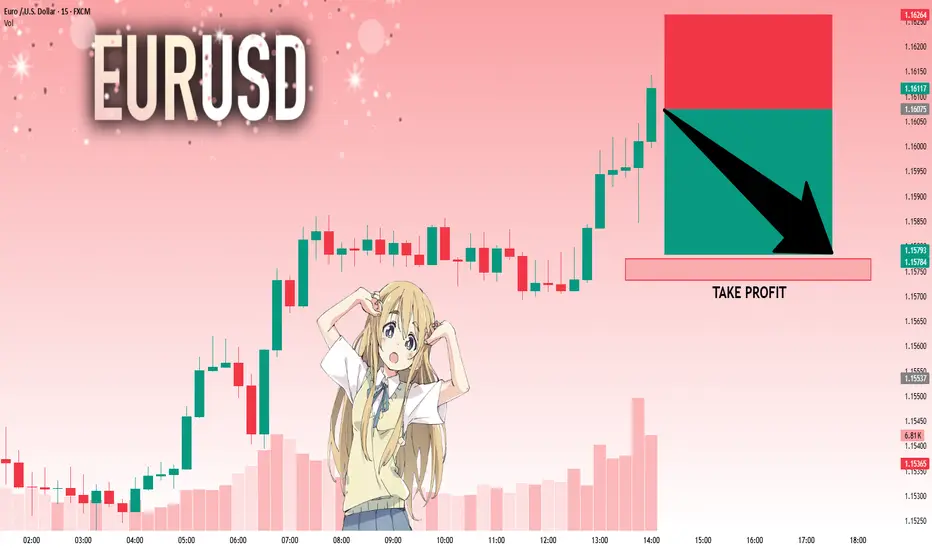
EURUSD: The Market Is Looking Down! Short!
My dear friends,
Today we will analyse EURUSD together☺️
The market is at an inflection zone and price has now reached an area around 1.16075 where previous reversals or breakouts have occurred.And a price reaction that we are seeing on multiple timeframes here could signal the next move down so we can enter on confirmation, and target the next key level of 1.15775..Stop-loss is recommended beyond the inflection zone.
❤️Sending you lots of Love and Hugs❤️
GOLD: Strong Bullish Sentiment! Long!
My dear friends,
Today we will analyse GOLD together☺️
The price is near a wide key level
and the pair is approaching a significant decision level of 3,393.80 Therefore, a strong bullish reaction here could determine the next move up.We will watch for a confirmation candle, and then target the next key level of 3,414.38.Recommend Stop-loss is beyond the current level.
❤️Sending you lots of Love and Hugs❤️

They called it consolidation. I called it accumulation.Price was coiled in a defined OB + FVG combo — building pressure while the rest of the market slept. The moment we swept the low into the Order Block, the trade became personal. This wasn’t noise — it was alignment.
Why I entered:
Daily FVG + OB overlap — textbook Smart Money entry zone
Volume spike at the OB low, signaling smart accumulation
Structural BOS confirmation on intraday after sweep
What followed was an impulsive push through inefficiencies, climbing level by level toward pre-defined liquidity pools.
Targets:
TP1: 2.6464 — rebalancing zone
TP2: 3.00 — clean inefficiency top
TP3: 3.39 — liquidity magnet
Trade thesis:
Entry was set between 2.05–2.10, stop placed with precision below the OB. No guessing. Just calculated structure + narrative.
I don’t chase moves. I let price come to my zone. And when it does, I strike with full conviction.
Final words:
“Your edge doesn’t scream. It sits quietly in imbalance — waiting.”

The FVG told the story. The chart just caught upThis wasn’t a pump. It was a re-delivery. Price tapped into the daily Fair Value Gap, respected the zone, and printed structure off the low. The retracement didn’t break us — it loaded us.
The logic:
The move began from an untouched Daily FVG — clean displacement, low retest, and now price is working its way through old inefficiencies. There’s no breakout here. Just one thing: delivery.
TP: 0.0163 — high timeframe imbalance resolution and prior volume pivot
The setup didn’t beg. It whispered. And now it’s unfolding, with confluence from every angle — market structure, volume, and intention.
Execution:
Entry: 0.0109–0.0113 (already in the zone)
SL: Below 0.0092
TP: 0.0163
Let others laugh at frogs. I’m here to extract liquidity from their disbelief.
Final thought:
“The move doesn’t care if you believe in it. It just needs a reason to unfold.”

EurUsd Daily Profile and expectation for New YorkMy Monday Protocol normally is to sit on my hands and see how Monday prints and trade from Tuesday onwards. With FOMC coming Wednesday, I'm allowed to deviate from this because Monday can be trending to "get somewhere in a hurry", trap Traders and go the other way during FOMC.
When I now look at the Market I see that London kept Asia Lows in tact and expanded higher leaving Failure Swings. Now consolidating which is normally a continuation signature... But then it should first sweep the consolidation Low and make a Reversal Signature. When we sweep or run the Consolidation High first, then the Long idea is not valid anymore.
Im watching the FVG below and see how we trade there and then decide if a Long is in play... I don't want to lose the Equilibruim Level of London Session otherwise the Failure Swings below the Market are the target.
Bottom Line, no hard Bias because its Monday. Favoring the Bullish side with FOMC on the Agenda this week, but not in a hurry to trade.
Hope you appreciate my content 👍
Happy Hunting, Stay Safe!
Warm Regards,
Mariinus

Bearish Gold ideaThe idea is somehow risky due to geopolitical tensions in the middle east conflict, but it could still play out for short first then bullish to a new all time high.

$BANANOUSDT New ATH possible, nay, plausible??
An extreme local inverse head and shoulders formation can be observed in the area circled in white.
trading just under local VWAP, great entry for anyone lacking potassium.
HL double bottom observable on the daily chart.
if recent trends continue to develop, a strong surge past $0.00162477 could lead to a increase in momentum.
$0.00210914 would be the next resistance, although weaker than the one currently testing. if price continues to develop past $0.00236478, ill be looking for TP1 at $0.00274825, another rough patch through til $0.00339408 follows, about 50% thru that zone would be a good TP2 and 100% thru the zone would be my TP3. the last major resistance would be at $0.00385154 (TP4). after that, a new ATH for COINEX:BANANOUSDT becomes an increasing plausibility. i am long potassium at $0.00143801
ANYONE HAVE MUSCLE CRAMPS?

CAD-CHF Potential Short! Sell!
Hello,Traders!
CAD-CHF made a retest
Of the horizontal resistance
Of 0.5990 and pullback is
Already happening so we are
Locally bearish biased and
We will be expecting a
Further bearish move down
Sell!
Comment and subscribe to help us grow!
Check out other forecasts below too!
Disclosure: I am part of Trade Nation's Influencer program and receive a monthly fee for using their TradingView charts in my analysis.
