EU Long IdeaWe are looking at the final stage of accumulation and waiting for FED rate to trigger it. All short sellers have been absorbed and longs are clearly taking place now.
Ict

Bitcoin - Bulls vs Bears: 88k or 100k?Bitcoin has broken through the 4H imbalance zone that also acted as an old resistance area. The break came through a clear displacement candle, which showed strong intent from the market. That same move left behind a new gap just under the previous resistance. Although price already retested that area once, it didn’t fully fill the gap, so we could see one more retest to complete the 50% line before the market chooses direction.
Consolidation Structure
The range before the breakout was clean, with multiple rejections from the resistance zone. That zone was front-run several times, then finally broken with conviction. Now, price is hovering just under that broken level, and the new gap created by the displacement candle is still fresh and technically unfilled.
Below current price, there’s a large inefficiency sitting between 88.2k and 90k. This zone stands out because it’s not only a clean 4H imbalance, but it also aligns with the golden pocket retracement from the last major leg up. That type of confluence usually attracts liquidity, especially if price gets rejected from the gap above and starts moving lower.
Bullish/Bearish Scenarios
The bullish scenario would play out if price manages to reclaim the gap zone, pushes back above the resistance cleanly, and treats the gap as support. That would be a classic structure flip, where the previous resistance becomes a new base, and the gap gets inverted into a continuation zone. If we see that, the next upside targets would sit around the 96k to 97k area, where more liquidity is likely resting.
On the other hand, if price moves into the gap and gets rejected again, that confirms sellers are still active at that level. In that case, I’d expect the market to push down and start filling the inefficiencies below. The 88.2k to 90k area becomes the primary draw. It’s packed with confluence from the 4H imbalance and the golden pocket, and it also lines up with previous demand zones. If price reaches into that area, it could trigger a strong reaction and potentially form the next higher low.
Price Target and Expectations
If we see rejection from the current gap, the target shifts to the 88.2k to 90k zone. That’s where I’ll be watching for bullish signs, since it’s the type of level where buyers often step in. A clean reaction there could be the start of a new leg higher. But if the market doesn’t get that low, and instead pushes up through the resistance, then the bullish breakout scenario is active, and we’d be aiming higher toward the 96k range or even the 100k.
Current Stance
Right now, I’m in reactive mode. The trade will depend on what happens at the gap zone. If we get another rejection from it, I’ll look for a move into the golden pocket below. If we reclaim the gap and break resistance, I’ll be looking to enter on confirmation of the flip. No trade from the middle, only once price gives clear direction from either key level.
Conclusion
This is a clean two-scenario setup. Either price fills the remaining gap and flips resistance, triggering the bullish continuation, or we reject from that area again and drop into the 88.2k to 90k range for a deeper liquidity grab. Both are valid, and both offer high-probability trades once price confirms the path.
___________________________________
Thanks for your support!
If you found this idea helpful or learned something new, drop a like 👍 and leave a comment, I’d love to hear your thoughts! 🚀
Make sure to follow me for more price action insights, free indicators, and trading strategies. Let’s grow and trade smarter together! 📈

NQ KEY ICT LEVELS - 8th MAY 2025Levels marked on the chart using my free indicator which marks out all of the ICT key levels which can be used for potential POIs where price might react

eurusd 2025-5-8ptice is bettwen to level
fvg 1hour on top and ssl level on bottom
so when price reach to this level we wait to see good setup to entry .
on top we should sell and on bottom we should buy

gbpusd 2025-5-8today price is near ssl side so we expect price go up
two ssl level are in the chart when price reach to this level we wait to see up setup then entre.
on top we have fvg 1hour that price reach to this level nwe csn tradde on it .

GBPUSD | 1H | BULLGood Morning Traders;
My target level for GBP/USD is 1.33966—just wait for this level and stay patient.
I put in a lot of effort to prepare these analyses for you, so don’t hold back on showing your support with a like! A huge thank you to everyone who supports me—every single like is a source of motivation for me to keep sharing my insights.

USDCHF - Bias, Narrative, ModelHere is some analysis on USDCHF for an intraday type of trade. Let's see if I end up taking a trade or not. All analysis done in the video.
- R2F Trading

GBPNZD: Support Rebound! Target 2.26 on the Horizon? The weekly chart of GBPNZD shows a consolidation phase following a strong bearish impulse. The price has reacted positively from the support area around 2.2200, forming a significant bullish candle that could indicate a rebound towards the resistance area at 2.2600. The positive momentum suggests a possible test of the intermediate resistance at 2.2500, with the RSI gradually rising from an oversold zone.
Fundamental Analysis
According to the COT data updated as of April 29, 2025, we observe an increase in long positions on GBP by institutional traders, with an increment of +10,665 contracts. On the other hand, commercial traders (hedgers) continue to maintain a significant short exposure on GBP. This imbalance may suggest a potential short-term speculative interest in a bullish GBP move.
Regarding NZD, the latest COT report shows a significant increase in commercial long positions (+3,884 contracts), indicating a strengthening of the New Zealand dollar. However, the overall market sentiment shows a prevalence of short positions on GBPNZD (59% short vs. 41% long), suggesting that retail traders might be on the wrong side of the market.
Seasonal Analysis
Historically, in May, GBP tends to show weakness (-0.0076 over the last 20 years), while NZD does not show a clear seasonal pattern. This could reduce the likelihood of a decisive GBP movement during this month.
Operational Strategy
The rebound from 2.2200 could favor the opening of long positions with the first target at 2.2500 and the second target at 2.2600. The stop loss could be placed below the key support at 2.2100. In case of a resistance breakout, an extension towards the 2.2700 area would be plausible.

AUD-CHF Bearish Wedge Pattern! Sell!
Hello,Traders!
AUD-CHF has formed a
Bearish wedge pattern
And the pair is now trying
To make a bearish breakout
So IF the breakout is confirmed
We will be expecting a
Local bearish move down
Sell!
Comment and subscribe to help us grow!
Check out other forecasts below too!
Disclosure: I am part of Trade Nation's Influencer program and receive a monthly fee for using their TradingView charts in my analysis.

NAS100USD: Volatility Opens Door for Sell Setup in NY SessionGreetings Traders,
As we enter the New York session—a period known for heightened volatility—we note that NAS100USD remains in a broader bullish environment. However, current price action suggests the potential for a short-term reversal, prompting us to explore selling opportunities.
Key Observations:
1. Bearish Internal Structure Developing:
Despite the overall bullish trend, internal price action reveals a sequence of lower lows, indicating the formation of a bearish microstructure. This internal weakness is reflected in the way bearish arrays—such as mitigation blocks and fair value gaps (FVGs)—continue to act as resistance zones.
2. Mitigation Block & FVG Alignment:
Recently, price delivered a strong displacement to the downside, followed by a retracement into a mitigation block that aligns with a fair value gap. This confluence reinforces the bearish bias and suggests institutional selling may be active in this zone.
3. Downside Targets – Gap Fill & Liquidity Pools:
The first downside target is a nearby inefficiency (gap) in price action, which the market often seeks to fill. The second target lies below, where sell-side liquidity pools are likely resting.
Trading Plan:
Monitor price behavior within the current resistance zone. If confirmation of continued bearish momentum appears, short positions targeting the aforementioned levels may be viable.
Stay focused and wait for confirmation before committing to any positions.
Kind Regards,
The Architect

Ultimate Guide to Master CISDCISD stands for Consolidation, Inducement, Stop Hunt, Displacement. It’s a simple, repeatable structure that shows how smart money sets up traps in the market to grab liquidity and then make a clean move in the opposite direction.
If you’re serious about trading the ICT style, this is one of the most useful frameworks to learn. It helps you avoid chasing bad breakouts and teaches you to wait for real setups that come after stop hunts and proper market structure shifts.
But there’s one rule that’s non-negotiable — a CISD setup is only valid after a liquidity sweep. If the market hasn’t taken out a clear high or low where stops are sitting, then the rest of the model doesn’t mean anything. No sweep, no trade.
1. Start With the Liquidity Sweep
Everything begins with the liquidity grab. If price hasn’t taken out a high or low where stops are stacked, you should walk away from the setup. Don’t try to front-run a move before smart money has done its job.
The liquidity sweep is what gives the rest of the move power. That’s when price runs through obvious levels, swing highs, swing lows, the Asian range, New York session highs or lows and hits stop losses. Those stops give smart money fuel to enter in the opposite direction.
When you’re watching the market, ask yourself this:
"Who just got stopped out?"
If you can’t answer that, then it’s not a sweep. And if it’s not a sweep, it’s not a CISD.
2. Consolidation — Where Liquidity Builds
This is the first part of the structure. Price starts to move sideways in a tight range, usually during Asian session or during parts of London where volume is low. It can last for hours or even across sessions.
The key here is to understand what’s happening. Traders are placing buys above the highs and sells below the lows. Liquidity is building on both sides. It’s a trap being set. Retail traders are expecting a breakout, but smart money is waiting to use that breakout to their advantage.
Your job in this phase is to identify the range and mark out the highs and lows. That’s where stops will be sitting. You’re not looking to trade during this phase. You’re watching and planning
3. Inducement (sweep)— Fake Break to Trap Traders
After the range is set, price gives a small push out of the range just enough to get people to commit. This is the inducement. It’s the bait.
Let’s say the range high is being tested. Price breaks just above it, traders think it’s a breakout, and they go long. Maybe it holds for a couple of minutes, even gives a small push in their favor. But then it rolls over. That’s the trap. Now those traders are caught, and their stops are sitting below.
Sometimes the inducement comes before the real sweep. Other times, the inducement is the sweep. What matters is that traders have been lured into bad positions and their stops are exposed.
As a trader, your job is not to take the bait. Watch how price reacts to these fake moves. Often, they come with weak volume or are followed by an immediate sharp reversal.
4. Stop Hunt — The Sweep That Validates the Setup
This is where the real move starts to form. Price aggressively runs through the level that holds liquidity, usually below the low or above the high you marked earlier.
This is when smart money takes out the traders who were induced during the fake move. Their stops get hit, and that gives institutions the volume they need to get into the opposite side.
You should be actively watching for a reaction here. Do you see rejection? Does the candle close with a strong wick? Are there signs of absorption or order flow flipping?
This is your validation point. Once price sweeps liquidity and starts to reject the level, that’s your cue to get ready for the next part, the actual shift.
5. Displacement — The Real Move Begins
Once the sweep happens, price doesn’t just drift, it snaps back hard. This is called displacement.
Displacement is a sharp, clean move in the opposite direction of the stop hunt. This is when market structure breaks, momentum shifts, and a fair value gap usually forms.
This is your confirmation that the setup is live. The sweep happened, smart money entered, and now the market is moving with intent.
You don’t want to chase the displacement candle itself. Instead, wait for the retrace. Look for price to come back into the fair value gap or an order block left behind by the impulse. That’s your entry point.
Make sure:
Structure is broken in your direction
The move away is impulsive, not choppy
You’re not forcing an entry on a weak pullback
This is the only part of CISD where you actually take the trade. Everything else is just setup.
How to Manage Risk and Entries
Once you’ve got a valid setup, here’s how to manage it:
Entry: Enter on the CISD or wait for the pullback into the fair value gap or order block. Enter on the reaction or confirmation.
Stop Loss: Place it just past the low or high that got swept. If you’re long, your stop goes below the stop hunt candle. If you’re short, it goes above.
Take Profit: Target the next liquidity level. That could be the other side of the range, a swing high or low, or an inefficiency in price.
You can scale out if price approaches a session high or low, or hold for a full range expansion depending on the session.
Final Thoughts
The CISD model works because it’s built on how the market actually moves, not indicators, not random patterns, but liquidity.
Don’t jump in early. Don’t guess. Wait for the sweep. Wait for the displacement. That’s where the edge is.
Once you get used to watching this play out in real time, you’ll start to see it everywhere. It’s in Forex, crypto, indices, any market that runs on liquidity.
Stick to the rules. Let the model do its job. And remember: no sweep, no setup!
___________________________________
Thanks for your support!
If you found this guide helpful or learned something new, drop a like 👍 and leave a comment, I’d love to hear your thoughts! 🚀
Make sure to follow me for more price action insights, free indicators, and trading strategies. Let’s grow and trade smarter together! 📈

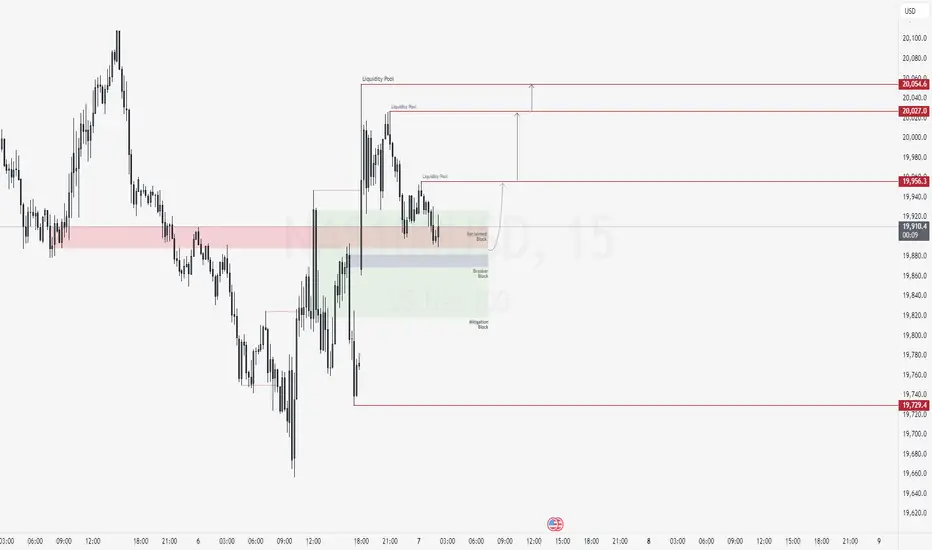
NAS100USD: Institutional Support Fuels Bullish MomentumGreetings Traders,
In today’s analysis of NAS100USD, we observe that institutional order flow remains bullish, and as such, we aim to align our trading opportunities with this directional bias.
Key Observations:
Institutional Support Zones:
Price has recently retraced into a significant institutional support area—a large mitigation block, where smart money typically mitigates previous sell orders and initiates new buy orders. This zone is further reinforced by the presence of a reclaimed order block, signaling an area where prior institutional buying occurred and may now be re-engaged.
Confluence of Bullish Arrays:
The alignment of the mitigation block, reclaimed order block, and an adjacent breaker block provides strong confluence. While price is currently showing signs of rejection at this zone, it is important to exercise patience and wait for confirmation before entering, especially given the size of the mitigation block.
Trading Strategy:
Upon confirmation, we will look to initiate long positions from these institutional support levels, targeting liquidity pools resting in premium pricing zones where buy-side liquidity is likely to reside.
Stay disciplined and let the market confirm your narrative.
Kind Regards,
The Architect
gbpusd 2025-5-7today we have little level to trade in the gbpusd .
on top we have pdh and on bottom we have pdl.
buy in case we have 50% of previous leg , on top of this level we can find sell view and bottom of this level buy view . remeber if you entry in 1 min find position in 3min

eurusd 2025-5-7price is near the pdh so our point of view is down
if price reach the the pdh we wait to see sell setup then trade.
on bottom we have some level that can buy on it , fvg 1h and eql .

AUD_USD WILL KEEP GROWING|LONG|
✅AUD_USD is trading in an
Uptrend and the pair made a
Bullish breakout of the key
Horizontal level of 0.6450
And the breakout
Is confirmed so as the pair keeps
Growing we will be expecting a
Further bullish move up
LONG🚀
✅Like and subscribe to never miss a new idea!✅
Disclosure: I am part of Trade Nation's Influencer program and receive a monthly fee for using their TradingView charts in my analysis.

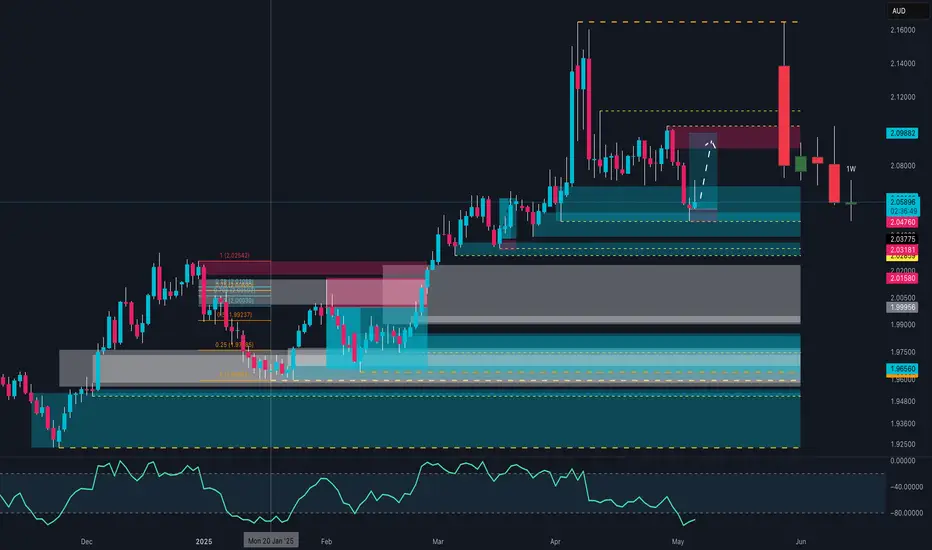
They Were 84% Short — Here's What Happened Next on GBPAUDThis is not just a simple breakout — this is what happens when data, price action, and psychology align with surgical precision.
Today, we entered a long position on GBPAUD directly from a well-defined weekly demand zone. The setup was already technically solid, but what made it exceptional was the alignment of multiple institutional-grade factors:
✅ Weekly demand zone respected to the pip, with proven historical sensitivity
✅ Change of structure on the H1 chart, confirming a short-term reversal from a deeply discounted area
✅ COT data showing a clear build-up of commercial long positions on the British pound
✅ AUD net positioning deep in negative territory, with declining open interest and no signs of reversal
✅ Retail sentiment: 84% of traders short on GBPAUD according to MyFxBook → strong contrarian signal
✅ Seasonality: GBP tends to outperform AUD during May and June
The result? A rapid and aggressive bullish impulse that allowed us to move the stop loss to break-even just a few hours after entry.
📌 Current trade status:
➤ Long from the demand zone
➤ SL at BE = zero risk
➤ Monitoring price action above 2.07 for potential continuation
🎯 Mid-term target zone: 2.1150–2.1300, with focus on liquidity clusters and previous inefficiencies as potential magnets.
This is how you build trades that are not just reactive, but proactive — based on multiple layers of confluence and edge, not on emotions or noise.
NQ KEY ICT LEVELS - 6th MAY 2025Levels marked on the chart using my free indicator which marks out all of the ICT key levels which can be used for potential POIs where price might react

gbpusd 2025-5-6some level in the chart shows we can trade on this day .
on top fvg 1h , pdh . when price go up and reach to this level we wait to see sell setup then trade .
on bottom fvg 1h , pdl . when price go down and reach to this level we wait to see buy setup then trade .

eurusd 2025-5-6today we have some place trade
on top fvg 1h , pdh . when price go up and reach to this level we wait to see sell setup then trade .
on bottom fvg 1h , pdh . when price go down and reach to this level we wait to see buy setup then trade .

GOLD - Smart Money Selling, Retail Chasing Longs📉 Technical Context:
Price has reacted precisely to the 0.618–0.786 Fibonacci retracement zone between 3,386–3,442 USD, aligning with a clear weekly supply zone and imbalance. The current market structure suggests a potential lower high, with the first target around 3,060 USD, and the second near 2,880–2,900 USD demand.
🧠 COT Report (as of April 29, 2025):
Non-Commercials (speculators) cut 18,519 long contracts, signaling waning bullish conviction.
Commercials (hedgers) increased shorts by +9,848 contracts, maintaining a bearish contrarian stance.
📊 Retail Sentiment (MyFxBook):
65% of retail traders are short from 3,062, while 35% are long from 3,184 — ideal environment for a bull trap before reversal.
📅 Seasonality (Market Bulls):
May is historically weak:
10Y: -9.98%
5Y: -12.21%
Strength historically returns in June/July → a correction before continuation is likely.
✅ Conclusion:
Technical structure, macro context, and positioning all align for a high-probability short.
📍 Entry Zone: 3,420–3,440
🔒 Stop: Above ATH (3,500)
🎯 Targets:
TP1: 3,060
TP2: 2,900

A 3-Step Process For Analytical SuccessIn this video I go through the 3-step process of implementing a Bias, Narrative, and Model.
This process was a game-changer for me when it came to analysis, as well as taking actual trades. It considered high-probability targets, patience in waiting for traders to coming for me, and the calm of being prepared when it was time to take an entry. It filters out pointless trades, because if I don't have Bias, then I can't have a Narrative, and if I don't have a Narrative, then I don't have a Model.
I use ICT concepts, but this process works equally well for most other methodologies that aren't completely mechanical and algorithmic.
I give a real example of a trade I took yesterday on EURUSD where I utilized this 3-step process to frame a trade.
I hope you find this video insightful and gives you more clarity in your trading!
- R2F Trading

The Candles Are Bullish… BUT Is a Reversal on the Horizon?Back on April 28th, we talked about the ES potentially pushing higher — and guess what? It did exactly that! 🎯
Now we find ourselves at a key crossroads.
A new month is here, and with the previous monthly candle officially closed, there’s a strong case to be made for even higher prices — possibly up to the 5776 level. 📈 That said, I’ll be diving into the analysis today where I’ll also touch on some reasons why short-term selling could still show up.
To be fair, the price action from April (1st–30th) hasn’t given us a lot of evidence for a major reversal, but as always, it’s our job as analysts to stay sharp and open to all possibilities — especially in today’s climate.
Right now, I’m still on board the bullish train 🚂 and the charts continue to suggest upward momentum. But I’ll be watching closely for any shifts that might hint at a change.
What about you? What’s your take on the current setup? Let’s get the conversation going — I’d love to hear your thoughts!
Let's Keep Studying - One Candlestick At A Time!

US100 WILL GO DOWN|SHORT|
✅US100 price grew again to retest the resistance of 20,300
But it is a strong key level
And we are already seeing
A local bearish pullback
So I think that there is a high chance
That we will see a bearish move down
SHORT🔥
✅Like and subscribe to never miss a new idea!✅
Disclosure: I am part of Trade Nation's Influencer program and receive a monthly fee for using their TradingView charts in my analysis.
