EUR/USD 1H BREAKER BLOCK TRADE IDEAGreetings traders, I will outline the short I am currently eyeing on EUR/USD. If you pay attention to market structure it should be clear to you that EUR/USD is in a long-term downtrend and therefore higher probability trades will be found shorting this pair - the trend is your friend as they say. If you look at your 4H chart you will see the area of resistance which forced EUR/USD lower this week, this being the 4H bearish order block.
Moving onto the 1H chart we see that the market stop hunted the highs at June 22nd, rejecting at the close of the 4H bearish order block (4H -OB), then broke market structure to the downside as indicated by the grey horizontal arrow. Once this price action occurs, the bearish candle before the stop hunt is validated as a bearish breaker block (represented in the chart by the red rectangle and labelled as 1H -BB) and all one would need to do is wait patiently until price returns to the breaker to have a high probability bearish trade. That my friends is exactly what I aim to do - my entry lies a few pipettes below the close of the 1H -BB and my stop loss lies above the high of the breaker block. My targets are at the sellside liquidity pools below the respective lows of June 23rd but I will not marry this idea. Depending on how the market behaves I will take partials or close the trade entirely.
Remember traders, anything can happen in the market, the astute trader acknowledges this and seeks to manage risks while waiting patiently on his preferred setups. This is what is needed in order to thrive long-term in this game. Hopefully the market reaches our entry point, if it doesn't, unlucky, we move. If the trade loses, unlucky, we move, but one thing is for certain, we move.
May the markets be with you.
Ictbreaker

GBP/USD 4H Indicating BearishnessHi traders, it's yet another week and this means fresh opportunities in the majors. Today I bring to your attention the short position I am currently holding on GBP/USD . This pair is currently in a longterm downtrend, therefore the highest probability trades will be found shorting the pair, this frames my bias.
On May 4th the market ran just above the high of April 29th on FOMC volatility , the market then returned below this high, breaking market structure in the process, traders using institutional concepts refer to this as the stop hunt. With this framework, once price returned to the breaker which initiated the stop hunt, I entered my short positions. The stop loss of the trade is placed above the 4H breaker block (the block is represented by the red rectangle ) and my final take profit level is placed at the high of the 4H fair value gap. The level represented by the blue line indicates where I will take my first partial if price moves in my favour. I have selected this level since it is an area of mitigation and so price can bounce from there.
More details of the overall framework of this trade is explained in further detail in my first publication, which can be seen below this publication in the "related ideas" section. I really appreciate you for reading this post and remember, buy/sell at levels that make sense and let the market do the rest.
May the markets be with you.

THE ICT BREAKER!hello, so you want a model that will get you profits? LOOK NO FURTHER!!!!
this is the ICT BREAKER, this mode (and other confluences) is ALL, YOU, NEED.
if you confluence the BREAKER with...
- BMS
- OTE
- PREM /DISC RANGE
- INTERNAL LIQUIDITY
WHAT. MORE. COULD. YOU. WANT.
what is labelled, as the purple box, THAT IS YOUR BREAKER BLOCK, YOU TRADE IN HERE WITH THE RIGHT FRAMEWORK AND CONFLUENCES.

ICT BREAKER SETUPhello, so you want a model that will get you profits? LOOK NO FURTHER!!!!
this is the ICT BREAKER, this mode (and other confluences) is ALL, YOU, NEED.
if you confluence the BREAKER with...
- BMS
- OTE
- PREM/DISC RANGE
- INTERNAL LIQUIDITY
WHAT. MORE. COULD. YOU. WANT.
what is labelled, as the purple box, THAT IS YOUR BREAKER BLOCK, YOU TRADE IN HERE WITH THE RIGHT FRAMEWORK AND CONFLUENCES.

GbpAud_Swing_H41. H4 ICT Breaker
2. M15 BOS (Break of Structure)/BMS (Break of Market Structure)
Potential TP Zones:
TP1. 1.8300
TP2. 1.9100

Gap fill and continuationWith price showing willingness to move lower, this is the current idea. Mostly for my records and review

SHORT BAIS ON CADJPYI'M looking to short CADJPY once the equal highs gets taken out, and i'm looking to take my profit at the previous low. its a swing trade

BTCUSD✓From monthly timeframe BTC is falling and is expected to go below 38000 befort regain it's momentum up.
✓Break of Market structure observed at 406500, which indicates the probability for price to drope is so high.
✓ price also show strong resistance zone at 42290.
✓ This zone can also be considered as liquidity zone, therefore an interesting area above it can be valid entry setup for sell.
✓The high probable selling zone is between 42500 and 42750.
✓ At this zone one can find any berish confirmation and enter or can enter direct and put stop loss above the zone.

ICTEURGBP FOMC DAY since take the buy stop and break lower i want to support the price 60 minute FVG and 15 minute breaker and run on proximal sell stop


EurNzd EurNzd TGIF i expect to trade one of this levels not zones the reason i said that is all week EurNzd was one sided from Monday to Thurs it break Market structure on traded 4h FVG Discount Low and break low

Dollar Index {DXY} High Time Frame Analysis Dollar Index {DXY} High Time Frame Analysis my bias this week is bullish on dollar index we want to get setup one of this levels and see how Sunday candle may open and how the weekly candle form i mean weekly template the heavy high impact on this week is Tuesday & Weds day we expect manipulation accumulation & distribution

ICTDollar today Tue, 16 November i expect to run previous daily high in form of buy stop there is high impact news on New York Kilzone at 8:30 Core Retail Sales m/m
i want to see how they use the news on catalyst

USDCHF - Looking for Reversal in the Following WeekUSDCHF
SELL LIMIT @ 0.92917
Stop Loss: 0.92998 (Add Spread)
TP 1 (1R): 0.92837 (20%, SL → BE, Scalp TP )
TP 2 (3R): 0.92677 (30%)
TP 3 (5R): 0.92516 (30%)
TP 4 (10R): 0.2115 (20%)
Explanation: Looking for price to test this resistance area in the late into this week or at the start of the 26th week. The rejection from the level might suggest we will get some impulsive price action from the level. Will enter after seeing confirmation in the form of BOS or a Wyckoff schematic of some sort.

Will GME Close the Gap?After a simultaneous run on yesterday's and last week's highs, will GME now run for sell side liquidity and close the weekly gap? We shall see.

DXY SENTIMENTDXY looking all round Bearish. Highs were taken out by central banks and left imbalances the market needs to fill. Pay close attention to what the USD pairs moves, looking for set ups for the following week

Bearish top down analysis Smart Moneyhare a very interesting situation , price look beautiful daily barker block but in h1 price make a only push 1 and bounce 50 50 . but looking 200 ema price consolidate and may make new peak level . entry will m15 chart for many patterns

Backtest of Long position on GBPCAD- Just experimentingA general backtest of my strategy on a new pair, this was a risky entry and not one I'd usually take based on my trading plan but it was worth experimenting and deciding whether I'd want to expand my pairs. I will likely not.


Either way Price broke bullish structure (seems more like a pullback to me to get long) into bullish breaker and we saw price move aggressively to the upside. Price is trading in a range now, a swing low and a swing high has been highlighted waiting for a bullish or bearish break of structure.

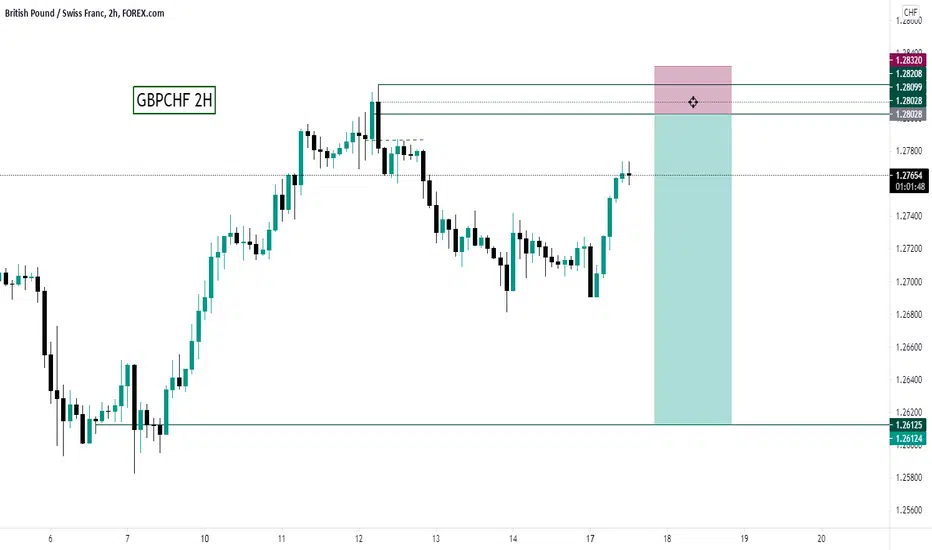
GBPCHF 90% WILL IGNORE THIS SETUPbreak of structure for potential downside movement {plus the daily time frame the price is approaching the equal highs meaning we might see sellers ,
THE WAY IN WHICH WE WILL USE TO APPROACH THIS IS ALWAYS BY BEING REACTIVE AND NOT PREDICITVE - NO CONFRIMATION - NO ENTRY .