Gold swing( PRE/ DIS ) + PDA + Dealing rang (HTF )
( LTF ) PRE / DIS + PDA + Dealing range
FOMC High risk be carful im loonking to short GOLD and Hold it's a swing opportunity not for scalp SL gonna be bigger so manage risk for swing not scalp i told u
Ictconcepts

| ICT Unicorn model | The most potent concept spotted on GoldThe Unicorn model is considered by many traders to be one of the most refined and effective concepts within the ICT framework concepts because it brings together several core ideas into one powerful, repeatable setup. But what makes it so highly regarded as one of the best?
It’s the ability to stack multiple high-probability conditions: liquidity grabs, market structure shifts, fair value gaps, and optimal trade entry zones.
Unlike isolated concepts, the Unicorn model doesn’t rely on just one factor. It uses the synergy between time and price → waiting for manipulation first, then entering during the retracement into a fair value gap or order block.
This not only increases accuracy but allows for tight stops and high reward-to-risk ratios. Many traders rely on it exclusively because it’s both structured and versatile, making it easier to apply consistently across various market conditions.
How does this work:
You’ll see the price breaks a swing high, reverses, and creates a Breaker Block (failed order block) with a Fair Value Gap. These overlap to form the “Unicorn zone” → After that, price drops sharply, breaking the previous structure, indicating a shift in market direction → Price retraces, entering the overlapping zone → Traders look for rejections (candlestick patterns, wick spikes) as the entry signal→ With entry near the zone, the stop-loss is placed just beyond the Breaker Block or FVG.
Targets can be the next liquidity levels (e.g., recent lows). Many traders use 2:1 or 3:1 R:R, though targets can be higher.
In other words as a standalone strategy, the Unicorn model is highly effective , if, and only if, you have the correct daily bias. With a clear directional outlook, it becomes a complete and reliable setup.
Which in our case, on Gold it aligns perfectly.
Just sharing my thoughts for the charts, this isn’t financial advice. Always confirm your setups and manage your risk properly.
Disclosure: I am part of Trade Nation's Influencer program and receive a monthly fee for using their TradingView charts in my analysis.

The Unicorn Model: : Guide to ICT’s Best Standalone setup🦄 The ICT Unicorn: The Most Powerful Setup in ICT
Among all the concepts of ICT, the Unicorn setup stands out as the ultimate precision entry model, it’s confluence perfected. Why? Because it merges two of the most potent ideas in ICT theory: Breaker Blocks and Fair Value Gaps into a single zone.
This combination creates the most high-probability, sniper-level setup in the entire ICT playbook.
Why It’s the Best you think?
Most ICT setups (like simple FVGs, order blocks, or liquidity sweeps) offer high-probability trades on their own, but the Unicorn setup stacks the odds in your favor by combining multiple layers of confirmation. This makes it the most disciplined and rewarding entry model for traders who rely on market structure.
Core Concepts Explained
A breaker block is a former order block that gets invalidated when price breaks structure, then acts as support or resistance upon a retest. It’s a sign of a shift in market intent, from bullish to bearish or vice versa.
A fair value gap (FVG) is a three-candle pattern where a sudden price move creates an imbalance, a "gap" between the wicks of the first and third candle. Price often retraces into that gap before continuing its trend.
When these two concepts overlap, a breaker block and a fair value gap in the same zone, it forms the “unicorn” setup. It suggests a strong level where liquidity has been taken and institutions may re-enter.
How the Setup Work s
First, you identify a market structure shift, like a break in a previous high or low. Then look for the breaker block left behind by that move. Within that block, check if there’s a fair value gap (the imbalance zone). When price retraces back into that confluence zone, wait for a reaction, often a strong reversal or continuation.
Entry is usually taken when price shows rejection within the zone on a lower timeframe. Your stop-loss goes just beyond the breaker block, and your target can be the next high/low or a logical liquidity pool.
Example of a bearish Unicorn Model:
Best Conditions to Use It
This setup works best when used in line with the higher timeframe trend. Many traders analyze structure on the 1-hour or 4-hour chart, then drop to 5-minute or 15-minute charts to enter. It’s commonly used in forex and indices but also works well in crypto or commodities.
Avoid using it during news events though. Like all ICT concepts, it requires patience and practice to identify clean setups and avoid forcing trades.
Example spotted on a Gold setup:
ICT Unicorn Model was first introduced in 2022, primarily applied to the Nasdaq 100 (NQ) and S&P 500 (ES). What stood out immediately was its precision, the kind of clean structure and consistency you don’t often find in most strategies.
As it was tested further, it was clear this wasn’t just for indices. The model transitioned beautifully into forex, especially on major pairs like GBP/USD and EUR/USD, delivering sharp entries as well.
I also tested it on metals like gold (XAU/USD) and silver (XAG/USD), as well as the Dollar Index (DXY), and the results spoke for themselves. Even in crypto, where volatility is the norm, the Unicorn setup held its ground.
It’s rare to find a trading model that adapts across markets this well.
Final Thoughts
The ICT Unicorn is all about confluence and precision. You’re not trading every breaker or every FVG, only the ones that align, especially with a clean shift in structure. When used with proper risk management, it can be a high-probability setup in your playbook.

NASDAQ Futures: My Plan for current Week (7-11 July, 2025)Week: July 7–11, 2025
Instrument: NASDAQ Futures (NQ)
Trend: Overall, the market remains bullish, but for this week I anticipate a retracement targeting the $22,582 level.
Bias for the week: Bearish
Overview:
This week, I’m watching NQ for a potential move toward the $22,582 level. This expectation is based on how Thursday (July 3, 2025) played out—specifically the buy-side liquidity that was taken, and the clean sell-side liquidity pool left near $22,582.
I also find it notable how the NWOG (New Week Opening Gap) was opened and how price moved below it, which reinforces the short bias.
I would consider opening a short position once I see a confirmed 4H candle close below $22,760, otherwise no trades will be taken.
* Trade execution details will be published separately if my bias confirms.
* for more information -> review my notes on the chart

#EURUSD: Nothing to expect from DXY| View Changed Swing Trading|Hey there! So, we were previously thinking EURUSD was going to be bearish, but things have turned around and it’s looking bullish for now.
The extreme bearish pressure on USD has caused all the major USD pairs to be in a range. As the week goes on and we get the NFP data, the market will probably focus more on these economic indicators. So, it’s not surprising to see some market ranges during this time.
We’ll keep a close eye on the market, as there might be some manipulation going on this week.
We recommend waiting until Monday’s daily candle closes to see if the bullish trend is strong enough. Then, based on the price momentum, you can make your decisions.
We hope you have a great week and safe trading! If you like our work and analysis, please consider liking, commenting, and sharing our content.
Cheers,
Team Setupsfx
❤️🚀

July 6, 2025: Strategic Forex Weekly OutlookWelcome back, traders!
In today’s video, we’ll be conducting a Forex Weekly Outlook, analyzing multiple currency pairs from a top-down perspective—starting from the higher timeframes and working our way down to the lower timeframes.
Our focus will be on identifying high-probability price action scenarios using clear market structure, institutional order flow, and key confirmation levels. This detailed breakdown is designed to give you a strategic edge and help you navigate this week’s trading opportunities with confidence.
📊 What to Expect in This Video:
Higher timeframe trend analysis
Key zones of interest and potential setups
High-precision confirmations on lower timeframes
Institutional insight into where price is likely to go next
Stay tuned, take notes, and be sure to like, comment, and subscribe so you don’t miss future trading insights!
Have a great week ahead, God bless you!
The Architect 🏛️📉

XAUUSD (Upcoming Plan with 2 Scenarios) Analysis for the upcoming week (InShaaAllah) (2 Scenarios)
Breaking: Trump says tariff letters to 12 countries signed, going out Monday...
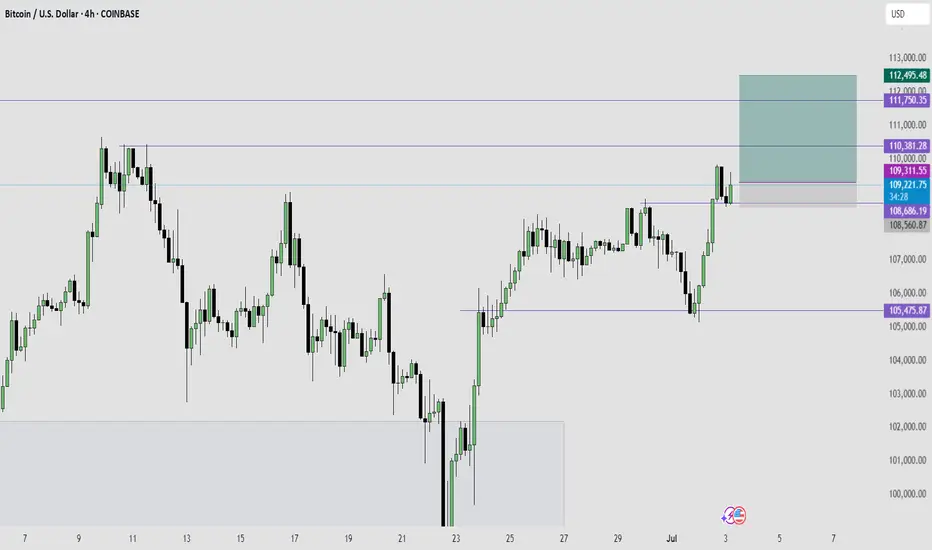
Bitcoin – ATH Sweep or Breakout?Bitcoin is pushing into a critical decision point as it challenges the previous all-time high near 110k. After a strong push out of a rounded bottom formation with clean higher lows, price has now broken above the last visible resistance area and is hovering just under the ATH liquidity. This rally has been aggressive, but the reaction here will determine whether this move becomes an extended breakout or a classic trap.
Liquidity and Key Resistance
The ATH zone around 110k carries a large pool of liquidity, and price is now testing it for the first time since the breakout. We’ve already had a clean break above the prior resistance zone, but we haven’t yet seen a confirmed close above ATH with convincing volume. If price manages to close strongly above this level on the 4H or daily chart, that would be a sign that bulls are in full control. Until then, the possibility of a sweep and rejection remains firmly on the table.
Sweep Scenario and Downside Levels
If we fail to close convincingly above the ATH and instead see a wick through followed by a strong reversal, that would confirm the sweep. In that case, I’d expect short setups to activate quickly, with downside targets sitting around 105k. This level marks the structure support below the most recent breakout, and would be a logical point for price to rebalance before continuing any broader uptrend. A rejection from current levels would also trap late longs and provide fuel for a quick retracement.
Bullish Breakout Scenario
If we do get that proper breakout above 110k, backed by strong volume and continuation candles, the upside opens fast. There’s very little structure above the ATH, so price could move cleanly up into the next round psychological target around 115k. This move would confirm continuation of the higher timeframe trend and offer short-term breakout retests for potential long re-entries.
Volume and Candle Confirmation Are Crucial
At this stage, the setup is binary and all about confirmation. A clean 4H or daily close above ATH with follow-through volume will flip the bias fully bullish. But if we get signs of exhaustion and a failed breakout attempt, the sweep setup becomes highly probable. Waiting for confirmation here is key, rather than trying to front-run the move.
Conclusion
Bitcoin is sitting right at a high-stakes level. We either continue into price discovery toward 115k if momentum follows through, or we see a classic liquidity sweep and rejection back into 105k. The clean structure and recent higher lows support both sides of the argument, but execution will depend on how price reacts around the ATH. Either way, this zone is the key pivot for the next major swing.
Disclosure: I am part of Trade Nation's Influencer program and receive a monthly fee for using their TradingView charts in my analysis.
___________________________________
Thanks for your support!
If you found this idea helpful or learned something new, drop a like 👍 and leave a comment, I’d love to hear your thoughts! 🚀

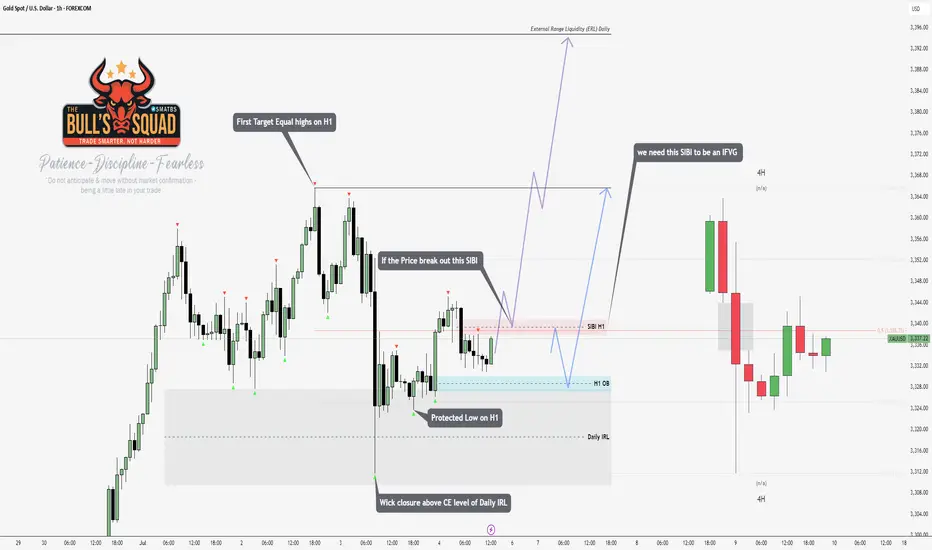
Gold HFTHTF trade using fib 0.5 respected + Dealing range on the LTF
waiting for retracement didn't happen gold is stronger today so the best is to look at HTF nice SIBI waiting for the purg targeting SSLQ be carfull 4th of july so market will close early and maybe we don't reach our target so take profit maybe we gonna face reversal so too risky

BTC LONG TRADE IDEAThis is a bullish trend continuation trade idea on BTC.
Trend across all higher time frame is bullish.
EURJPY LONG IDEAI have been waiting for this EURJPY long setup to form for the past 2 trading sessions.
This morning I saw this beautiful bullish swing low formed and that is my entry signal for to take a long trade on EURJPY.
REASONS:
EURJPY is super bullish right now.
The Daily and 4Hour time frame trend is extremely bullish. So, am only looking to take a long buy to follow the trend direction.

BTC to sweep liquidity?4 Hour Analysis:
- Market moving out consolidation phase (Accumulating late buyers)
- May sweep the 1st buyside liquidity (see chart)
- Or may sweep the ATH above the 1st buyside liquidity (see arrow on the right of the chart)

Buys on Gold based on 50% candle range and order blockGold has been dropping but there has been lack of volume which indicates the sellers going out and we just took out the 4hr 50% of the long wick , also having an 1hr Order block, which makes me looking for buys

GALA GOING TO MOON ''AS per my analysis gala meet the daily advanced order block at 0.01710 and mitigation block at same level and there is also a bullish order block FVG of daily time frame At 0.01780 to 0.01540 these all are IMPORTANT POI and its help to reverse the trend and other side if we talk about the target we can see recent swing high 0.02040 0.02194 and 0.02363 these level contain high liquidity and price must go to grab the liquidity and there is 1D bearish order block at 0.03294 we see the price soon at this level "
BAIS:- BULLISH
ENTRY:- 0.01710
STOPLOSS:- 0.01410
TARGET :- 0.03290
DISCLAIMER :- its not a Financial Advice
THANK YOU ;

Trading AUDUSD NZDUSD | Judas Swing Strategy 25/06/2025This week the Judas Swing strategy has delivered two clean setups on OANDA:AUDUSD and $NZDUSD. Both trades played out beautifully, hitting their targets and ending the day with a solid +4% return (2% each), reinforcing the power of patience, structure, and sticking to the rules.
Let’s break down how each trade unfolded:
Trade 1: OANDA:AUDUSD Long — Textbook Setup
We kicked off Wednesday’s session watching OANDA:AUDUSD closely after identifying a classic Judas Swing scenario.
First, we saw liquidity swept below the previous session’s low, exactly what we’re looking for. This kind of move is crucial to the strategy, it grabs early sellers or stop orders and sets the stage for a reversal.
Right after the sweep, price broke structure to the upside, confirming our bullish bias. At this point, we didn’t rush in. We waited for price to retrace into our FVG (Fair Value Gap).
Patience paid off and price finally tapped into the FVG, and as soon as the entry candle closed in our direction, we executed the trade.
We risk 1% on every trade, aiming for a 2:1 reward-to-risk. After being in drawdown for a bit, price accelerated sharply and hit our target after being in the trade for 5 hours. Clean setup, clean execution, and a smooth +2% return.
Trade 2: OANDA:NZDUSD Long
OANDA:NZDUSD presented a near-identical setup. Price had been consolidating, but by the time the NY session rolled in, the stage was set.
Just like OANDA:AUDUSD , we saw a liquidity sweep at the lows, followed by a bullish break of structure, textbook Judas Swing again.
This time, the retracement into the FVG came swiftly. We executed as soon as we had confirmation on the candle close.
The trade barely hesitated, and price moved decisively in our direction, steadily climbing until our target was hit. Another +2% return, reinforcing the strategy’s strength when rules are respected
What This Week Reminds Us:
Discipline matters: We don’t chase trades. Both setups met all our checklist criteria
Patience is key: Waiting for the FVG entry and confirmation avoids emotional entries
Risk management is the foundation: With a 1% risk and 2:1 target, you only need to win half the time to be consistently profitable
When you follow a rules-based strategy like Judas Swing, you remove the guesswork and bring structure to your trading decisions.

EUR/JPY higherPrice retraced from Weekly FVG. The retracement had high momentum down, making Fair Value Gaps on the 4H. After 3 things aligned:
1. Price made new 4H Fair Value Gap coming from the Daily Fair Value Gap
2. Price disrespected Swing High in 4H Fair Value Gap
3. Rejection off D FVG closed with perfect 2 candle rejection.
I entered the trade after I've seen the close on the daily timeframe, Stop below the 4H Fair Value Gaps.

EURAUD: Possible Swing Movement of 660 pips expected! FX:EURAUD on daily candles of last few days breakthrough and now dropping back to demand zone where we expect price to bounce strongly and at least we expect target one to accomplished by end of January. While target two and three remain a long away from our current price area. Stop Loss should be below the strong wick of daily candle.
From fundamentals side AUD will be weaken and EURO can be bullish for next few months, taking entry will require a strict risk management as this is a swing trade, do not expect to achieve the target in couple of hours or days.
Good luck and trade safe.

NASDAQ READY TO CONTINUE THE LONG-TERM WEEKLY BULLISH RUN
FX:NAS100
I just entered this buy trade on Nasdaq on the daily time frame.
The trade setup is a Swing trade following the monthly and weekly orderflow.
The Monthly is bullish, the weekly is also bullish, so I entered on the daily time frame retracement.
My overall take profit is a risk reward of 1:4.

GBPUSD IS LOOKING WEAK FOR A HARD SELL OFF SWING TRADEOANDA:GBPUSD Has broken the bullish swing low on 4 Hour time frame with strong sell off bearish candles leaving behind a big bearish imbalances in price. Which extra confirm that price is extremely bearish on 4 Hour time frame.
Now that trend has shifted from bullish trend to a bearish one, am now bearish on GBPUSD.
Bearish shift in market structure that happened on OANDA:EURUSD EURUSD which is a correlating pair with GBPUSD extra confirm this bearish bias on GBPUSD.
likewise also, the Bullish Shift in Market Structure on OANDA:USDCAD USDCAD, which is an opposite correlating pair confirm this sell on GBPUSD.
So, my focus now is selling GBPUSD in every pullback or retest of key bearish levels.
I will update you as the trade develop.

USDCAD SWING TRADE LONG IDEA - MASSIVE BULLISH MOVE COMING?OANDA:USDCAD USDCAD has given a massive bullish break of structure on 4 Hour time frame after tapping to a strong key level on weekly time frame that is serving as support.
Now am bullish on USDCAD for a weekly income swing trading moves.
All I need right now to enter for a long to ride the move is a pull back to key level of support like old highs or imbalance levels.
That is when I will take a bullish long trade on USDCAD.
This is my A+ Trading Setup.
What do you see on your chart?

Could be a Crazy BuyBeen waiting for WEEKS to see GBPAUD Trade into a Daily Orderblock.
Now, Usually, we wait to see how price reacts at this level.
However,
The reason I say this could be a great buy is because
- Dollar Correlation
- Old weekly and Daily Lows Swept
-Liq. Swept into Daily OrderBlock
- London Killlzone
- Its my girl GBPAUD

Bearish USD/CAD Presents a Selling Opportunity Now.FenzoFx—USD/CAD surged to 1.3686, a resistance zone backed by a bearish Fair Value Gap. Stochastic shows 81.0, signaling short-term overpricing. The market remains bearish below 1.3729, with fundamentals pointing to a stronger CAD.
A decline toward 1.362 is likely if USD/CAD stays below 1.3729.

Traders, it's time to pay close attention! 🚨 USDJPY 4H Setup Alert – High-Probability Play Unfolding! 🚨
Traders, it's time to pay close attention! 🧠📊
The USDJPY pair has just perfectly tapped into a key bullish Fair Value Gap (FVG) on the 4-hour chart — a classic move in the smart money playbook. What’s more? We've just seen a clean sweep of internal range liquidity (IRL) — a textbook liquidity grab that signals potential accumulation by larger players. 💥💼
This is not just noise — it's a significant signal. The market structure is hinting at a possible shift in momentum, and bullish pressure is building. The trap has been set, the weak hands have been shaken out, and smart money may be preparing for a strong upward push. 📈🐂
🔮 What’s the next move?
All eyes are now on the external range liquidity (ERL) — a prime liquidity pool sitting above current price levels. If price accelerates toward it, this zone could act as the magnet and the catalyst for the next explosive move upward. 🚀
🔥 Key Points to Watch:
Bullish FVG reaction ✅
IRL liquidity swept ✅
Bullish market structure forming 🏗️
ERL liquidity resting overhead — potential target 🎯
Volume profile & order flow confirming accumulation? 👀
⚠️ Stay alert and don’t chase — let the setup come to you.
Smart money might already be stepping in, and if this momentum follows through, we could be witnessing the beginning of a strong leg up.
Mark your charts and monitor closely — opportunity is knocking. 📍🕵️♂️
