Could We Be Going Long???Daily: Monday's candle swept below Friday's low and closed bullish. Price is still extended at a higher high in the daily bullish trading range. Price can potentially move higher into the previous day's high.
4hr: The 4hr trading range is still bullish in the corrective phase back into the 4hr volume profile POC, but we can see a potential reversal for longs playing out if the price closes above 20286.50 on the 4hr
m15: If that happens I will look for a pullback sweeping sell side for long entry
Again, we let the price develop overnight before the NY session and updated in the morning to see if anything had changed.
Since NQ and ES move in the same direction I will be monitoring for divergence or convergence between the two
Ictconcepts

NAS100USD: Bearish Setup Targeting Weekly FVG!Greetings Traders!
Brief Description🖊️:
Currently, on NAS100USD, I am anticipating a potential bearish draw in price action. The M15 chart has shown the beginning of a bearish decline, and it’s crucial to follow the market's trend until signs of reversal appear. One key confluence is the respect of an H4 bearish order block, establishing a firm resistance zone.
Things I Have Seen👀:
H4 Bearish Order Block Resistance🟥: Price is respecting this zone, confirming it as strong resistance.
M15 Buy Stops Cleared✅: Price cleared M15 buy stops above the resistance before reversing, indicating smart money engineered liquidity before driving price lower.
M15 FVG & Bearish Order Block: These are the zones where I will be waiting for confirmation entries.
Bearish Targets🎯:
Weekly FVG (19,760.8): This is the primary target for the bearish continuation.
What's Important Now❗
Monitor price action around the M15 FVG and bearish order block for confirmation before entering. Ensure to conduct your own analysis to validate this outlook.
Best Regards,
The_Architect

Okay what's my bias on EU?Price action lately is kinda tweaking. But to my research, I am still looking forward to a bullish trend toward the DOL I marked last week. Tho it showed SMT divergence with GU so yall gotta be careful.
Peace.
Hope I have been helping you guys

XAU, our opp :skull:Well, about XAUUSD, I noticed it broke ATH multiple times, cuz of war and government stuff.
I think long term, it will retrace back to the weekly FVG I marked.
But be careful with the internal liquidity down there, that's all.
Peace.
Hope I can help anyone.

Let The Price Develop Daily: Last week, the price extended higher until Thursday staying in the daily higher high range
Friday's price closed lower potentially starting a corrective phase this week
4hr: The 4hr trading range is still bullish but has now started the corrective phase back into the 4hr volume profile POC, There is a bullish imbalance sitting around the 20,138.00 area that could act as potential support, but we would need confirmations for longs
m15: Since the 4hr is in correction, the m15 is bearish, and we can see potential short-term selling. I will be watching 20,255.00 to 20,221.00 levels for shorts.
Of Course, let the price develop overnight before the NY session when I will update to see if anything has changed.
Since NQ and ES move in the same direction I will be monitoring for divergence or convergence between the two

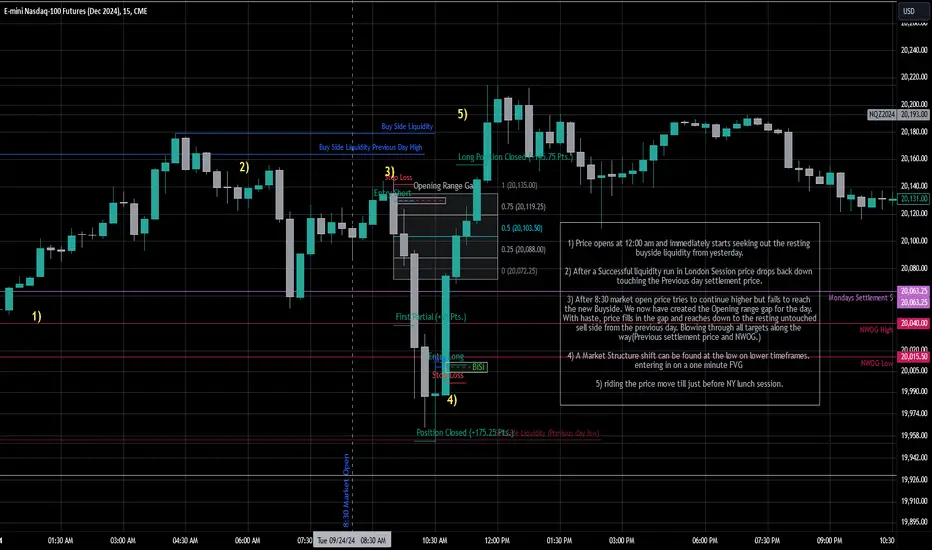
Tuesday Surf Session (NQZ2024)1) Price opens at 12:00 am and immediately starts seeking out the resting buyside liquidity from yesterday.
2) After a Successful liquidity run in London Session price drops back down touching the Previous day settlement price.
3) After 8:30 market open price tries to continue higher but fails to reach the new Buyside. We now have created the Opening range gap for the day. With haste, price fills in the gap and reaches down to the resting untouched sell side from the previous day. Blowing through all targets along the way(Previous settlement price and NWOG.)
4) A Market Structure shift can be found at the low on lower timeframes. entering in on a one minute FVG
5) riding the price move till just before NY lunch session.
This is not trade advice just for my own studying and journaling.
My best trade of the year:This was my best trade of the year.
Its no surprise, the way it lined up:
1hrRJ (previous day session)
Above Asia
LL Confirmation
15minOB Entry
DXY Correlation

Tricky Spot Thursday's candle closed above the prior day's high, reaching the weekly SIBI, overnight in the Asian session the price rallied, consolidated in London, and Reversed In the NY Session
4hr market structure is still bullish but at the top of the range creating a bearish reversal with high volume that created a bearish SIBI retesting value area high or the 4hr trading range/4hr Fixed Volume profile the 4hr bullish bars that traded away from POC showed an increase in volume but the bearish volume was higher
m15 has two potential areas from long at 20,271.00 or at 20,140.00
but I'm being mindful of the 20,406.00 to 20,362.00 level that can act as resistance causing longs to get squeezed out of their positions
I will review what happens overnight
Since NQ is typically correlated with ES I will monitor both for direction confirmation and divergences and convergences

A SWING BULLISH SCENARIO FOR THE POUND?DOLLAR (GBPUSD) PAIRClearly price is in an upward trajectory as price recently gave us a break of structure from July 2023 high which was a pivot point and a strong high for price . Previously we saw price gave us a break of structure to the downside from the highs that were created in may of 2021 around 1.4247 and the low that gave a BOS in sep of 2022 around 1.0343 which prompted price to trade back into premium zone of these two ranges. Price tapped into 0.705 fib level around 1.0309 in July of 2023 and immediately rejected which is normal if price is meant to continue downward. but price sold and found support around 1.0204 in Oct of 2023 which technically means a trendline is activated to support price suggesting market participants expect a possible trending market to the upside . Now recently price has violated 2023 high which was supposed to be intact if we are bearish, thus confriming the possibilitiesof an uptrend. possible next supply zone for price will be equal 2021 highs or monthly bearish ob around 2021 highs. If the consequent encroachment of the ob fails to resist price then price will either use 2021 highs as draw on liquidity to retrace back into fib OTE levels or just break above, either ways that zone is GU's next line of defense.

I took another profit at 65650BINANCE:BTCUSDT.P
Now I cut 80% of my position and keeping 20% for the terminus target.

Well... what about USDJPY?There will be two scenario.
Either price take that Daily High as liq grab(or inducement) to fall, if that is the case there should be some of these sign:
Price consolidate when it about to come to that high, quick grab and fall strong.
If not, it would just go straight to the DOL, which i prefer would happen.
Make sure to do partials.
Peace

Bullish into Weekly SIBIWednesday's candle closed above the prior day's high, reaching the weekly high as well as the previous month's high, we could potentially see the price continue to rally into weekly sibi
4hr market structure is still bullish but after the rally, the price has now closed above 4hr swing-high
4hr Fixed Volume profile shows the POC is at the high of a price and now price action is moving away from that area in a bullish fashion
m15 has two potential areas from long at 20,221.00 or at
if the Asian session continues to expand we will have to see how London's action is traded especially if the price reaches the w-sibi first in the overnight session which could result in a NY session reversal
Since NQ is typically correlated with ES I will monitor both for direction confirmation and divergences and convergences

Eye For Longs wiith Caution Tuesday's candle closed above prior day high, as well as reaching weekly high
4hr market structure is still bullish but after rally price failed to close above 4hr swing high
4hr Fixed Volume profile shows the POC is at the highs on the 4hr price attempted to move away from POC in a bullish fashion but could be a weak move due to the failed closure
I want to see what develops over night to get a clearer picture
but i do see a potential area for longs at 20,097.00 or 20,060.00
Since NQ is typically correlated with ES I will monitor both for direction confirmation and divergences and convergences

what's with EU now ?For everyone, i recommend to do your own research.
-EU might continue to hit the weekly DOL
-Considering this view is not possible if the next 2 weeks is bearish and displace strong below.
I'm in the same journey as you guys are, I hope I can help anyone.
Peace be upon you

NAS100USD: Bullish Momentum with Focus on FVG Targets!Greetings Traders!
Brief Description🖊️:
Currently, NAS100USD is displaying a bullish delivery in structure, with institutional order flow entirely bullish. It's crucial to align with the market trend by identifying price action confluences that present buying opportunities. The H1 structure is supporting a daily Balanced Price Range (BPR), where the market has efficiently delivered price. Given this, I anticipate further bullish movement as price seeks to fill inefficiencies like Fair Value Gaps (FVGs) and Liquidity Voids.
Things I Have Seen👀:
Bullish Institutional Order Flow📈 : The market is delivering bullish price action, supported by H1 structure.
H1 Buystops Taken✅ : Price has cleared H1 buystops and drawn into an H1 FVG, where I am looking for confirmation entries for a potential continuation upwards.
Bullish Targets🎯:
H1 Bearish Order Block (20,355.7): This is the initial upside target, representing the last efficiently delivered price action.
FVGs Above: After reaching the H1 bearish order block, I expect price to fill the inefficient price action (FVGs) left above this zone.
What's Important Now❗
Monitor the H1 FVG for confirmation entries and align with the overall bullish structure, as price is likely to continue its upward trajectory toward filling inefficiencies in the market.
Best Regards,
The_Architect

Xag-USD Price creat our Context based on Daily Time Frame
We have D +OB as key Level
in 1h We have Bullish BRK overlaping with 1h +OB and IFVG
Target 2RR
disclaimer not financial advice

SPX Key $ Levels | 70%+ Accuracy!New price targets for Sep 24 using Statistics and Data to drive a 70%+ historical accuracy.
Topics:
- Today's Targets
Overall we use stats and data pulled from a wide array of TradingView indicators and scripts so that I can have as much data as possible - even if it's unstructured or uncorrelated data. I then use AI and SOP's to systematically calculate a weekly and daily framework. My predictions are never 100% but ALL of them are mathematically proven to be 70%+ accurate historically or I wouldn't use them.
Most indicators I use on my Data Dashboard chart has the stats in their associated boxes that I show during the recording if you'd like to verify yourself.
Please leave me feedback as I am new to creating content and would like to improve.
Personally I use these targets in combination with ICT Concepts to trade.
Nothing I say is Financial Advice - Previous performance does not guarantee future success.

two scenarios for EU?for Monday price fluctuated a lot, i don't expect to trade today until price touch the DOL i set.

Cautionprevious day indecision candle shows that
we have some uncertainty at the highs
4hr market structure is still bullish but we acre consolidating
4hr Fixed Volume profile shows the POC is at the highs meaning fair value for price
I will not be considering buys just yet unless price breaks 20107.25 on the 4hr or
we have a market structure shift
on the m15 from 19,934.00
Since NQ is typically correlated with ES I will monitor both for direction confirmation and divergences and convergences
update as price develops

NQZ2024 long pm scalp, targeting 1min equal highs Using a inversion FVG from the am session to go long, and targeting relative equal highs for buyside liquidity, to mitigate the previous loss.

Stopped out twice in NQZ2024 pm short in consolidation stopped out twice in NQ, trying to short the pm session in consolidation profile. -450 bucks in under 2 minutes :D

Bagging 40 on MNQ and leaving Working on my greed and patience, thankfully this was the right move to make, as I see in hindsight that at 10:59am the market completely reversed on this trade idea and melted lower.
Excited to see where the market is going to end up, I am just happy to end the day profitable, alive and well.

EU sell modele by ICT Concept Ict 2024 montership , using the first Fvg after 9.30 after taking buy side liquidity , market structure shift and enter on the IFVG , targeting minor sell side liquidity
