USDCAD bearishYou may open a position on a CMP or waiting for a little upside pullback before falling
Ictorderblock

Bearish orderflowHello Traders, here is the full analysis for this pair, let me know in the comment section below if you have any questions, the entry will be taken only if all rules of the strategies will be satisfied. I suggest you keep this pair on your watchlist and see if the rules of your strategy are satisfied

Bearish orderflowHello Traders, here is the full analysis for this pair, let me know in the comment section below if you have any questions, the entry will be taken only if all rules of the strategies will be satisfied. I suggest you keep this pair on your watchlist and see if the rules of your strategy are satisfied.

Still Valid - EURJPY Bullish OB on D1Bullish OB was formed on the EURJPY chart and price has come down to test it, where do you think it will go?
Comment Ideas and/or any reasons why you would or wouldn't take this trade!
Going long on EURJPY .
Setup:
Buy Limit @ 138.529
S/L: 137.871
T/P: 143.858
Why?
- Current overall momentum is bullish
- Retraced back up past 0.79 & 0.759( OTEs ) on Fib filling market imbalance left from previous sell
- Market imbalance left behind from previous buys (FVGs)
- We are already seeing some rejection from Bullish OB
- D1 Structure tends to be more reliable than lower timeframes
Why not?
- EURJPY has the potential to break Bullish OB and create a new low
- EURJPY created new swing low on lower TF.
--------------------------------------------------------------------------------------
Remember, only risk up to 5% of your account across all open positions.
This material is for educational purposes ONLY.
Trade smart.
--------------------------------------------------------------------------------------
Glossary:
OTE = Optimal Trade Entry (Most opportune place to enter a trade)
OB = Order Block (Where price is likely to make a reversal)
FVG = Fair Value Gap (Gaps left when only sellers/buyers were moving price down/up)

EURUSD-1D1. Fiber has clear Fair Value Gaps to fill as indicated in my chart.
2. Resistance line drawn & order block converge at the same level of 1.0400
3. Monday will likely to be low of the week & Tuesday will begin bullish expansion
4. Dollar Index is likely to be bearish this week up to 104.30 level which will make Major pairs bullish.
5. Watch out Fundamentals of this week. They will pour liquidity for bullish move

Will Gold remain bearish?This is a well I’m currently in as well. Been waiting to see if gold will remain bearish or not.

GBP/AUD Long SignalI'm not an investment adviser, I will not be responsible for any loss you encounter. This is just an idea on my market analysis.

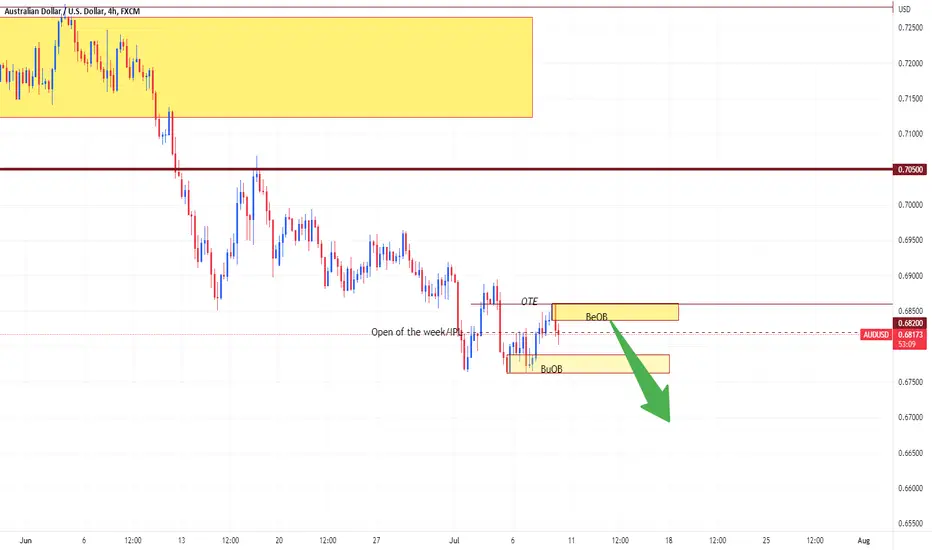
AUDUSD hits the Optimal Trade EntryHello traders,
The retracement that we saw occur since the Newyork opening on Tuesday is finally over. This is because the price has filled the price imbalance that was created on Tuesday.
On the ICT fibbs the price has hit OTE (Optimal Trade Entry) and created a bearish Order block (BeOB) which is an accumulation of sell orders.
The price should now continue with the downtrend.
Like if you agree
USDCAD might do wonders!!!no comment. At this time of the day, i do not expect such movement in price, but technically speaking this might be another sell setup, following the london open sell that occured in the morning.

Potential ReversalHaving slept through all the action I wake up to see that we have came right down from the 4hour OrderBlock level which I had anticipated shortly after the fakeout reclaim of 18750 making the Asia Low. This was too easy of a long to spot, I expect some sort of revisit to this level, potentially after a classic NY reverse if we can make that quite greedy level. I will forget this play (since it is primarily targetting just a 5min OB which isnt a big deal) if we fall below the current LON low, there I will look for more conservative entries.

GBPUSD ICT SMC ANALYSISGBPUSD possible long move price broke structure to the downside and broke structure again on the upside and consolidated before trading lower and grabbed liquidity on the down side tapped into our order block.

eurusd possible long demand zone met waiting for confirmation on the lower time frame for confluence then we'll look to go long

EUR/USD 1H BREAKER BLOCK TRADE IDEAGreetings traders, I will outline the short I am currently eyeing on EUR/USD. If you pay attention to market structure it should be clear to you that EUR/USD is in a long-term downtrend and therefore higher probability trades will be found shorting this pair - the trend is your friend as they say. If you look at your 4H chart you will see the area of resistance which forced EUR/USD lower this week, this being the 4H bearish order block.
Moving onto the 1H chart we see that the market stop hunted the highs at June 22nd, rejecting at the close of the 4H bearish order block (4H -OB), then broke market structure to the downside as indicated by the grey horizontal arrow. Once this price action occurs, the bearish candle before the stop hunt is validated as a bearish breaker block (represented in the chart by the red rectangle and labelled as 1H -BB) and all one would need to do is wait patiently until price returns to the breaker to have a high probability bearish trade. That my friends is exactly what I aim to do - my entry lies a few pipettes below the close of the 1H -BB and my stop loss lies above the high of the breaker block. My targets are at the sellside liquidity pools below the respective lows of June 23rd but I will not marry this idea. Depending on how the market behaves I will take partials or close the trade entirely.
Remember traders, anything can happen in the market, the astute trader acknowledges this and seeks to manage risks while waiting patiently on his preferred setups. This is what is needed in order to thrive long-term in this game. Hopefully the market reaches our entry point, if it doesn't, unlucky, we move. If the trade loses, unlucky, we move, but one thing is for certain, we move.
May the markets be with you.

Bullish tradeI look forward to risk 1% of my account on this great setup, I will be risking 5% on my Prop firm account. This is SMC.
Confluences:
1. Liquidity grab
2. Analysis time frame structure(Daily) is Bullish
3. Intraday time frame is also bullish
4. Price @ Discount level
5. Unmitigated POI on M3

GBPUSD | Critical Fulcrum Point 💰Buyside Liquidity is still there, if we manage to stay above the 4h Imbalance. Today with Fed Chair Powell today should clear the way and give us a confirmed bias.
Across all majors we could see a run lower before heading higher though.
Hope you find this one useful - good luck traders !

EURUSDit broke structure on daily timeframes and on h4 timeframes,now i am waiting for it to come down and sweep the stops then buy.

EUR/USD 1H FOMC TRADE ANALYSISHello traders, I will first preface this by saying trading FOMC is not recommended and this is simply a price action exercise. Moving on to the interesting stuff, this is what I see FOMC producing if we get a bullish leg first. Price will likely run up towards the low of the bearish mitigation block seen on the daily chart, this block contains an hourly bearish order block where institutions can add onto their already bearish positions. Volatility will most likely be extremely high with this FOMC announcement, therefore if price does go according to this analysis we could see targets for partials at 1.03578, 1.03341 and if price really gets away the monthly bullish fair value gap could fill all the way to 1.02500. Ofcourse, price could simply immediately fall from its current price at 2pm EST and never give a chance at entry for this trade idea or the stop loss for this trade could be hit, this is trading, anything can happen.
P.S This post may feel rushed that's because it is, I wanted to get this published before the FOMC announcement. However, I will be sure to provide a more detailed analysis of my idea once I have more time. May the markets be with you.

EURAUD Short signalEur/aud is getting closer to the unmitigated supply zone. Target given in the chart

Posible entryThere was an Buy Model, but was Invalidated, so the last BOS came to be a Neutralization and how is marked there is a bearish breaker.
I wait the recapitalization of the Liquidity pool until OTE level, and Order Block

Long Opportunity on GBPUSD towards ...In previous post I shared my interest in a long on Euro. However, GBPUSD seems to be the stronger one between the two based on recent price action on EURGBP.
Looking at GBPUSD, It stays in a bullish scenario as long as long as price doesn't fall below 1.2474. However, on an intra-day basis, i'm looking for GBPUSD to stay strong and break above today's daily high at 1.2562 and potentially head towards 1.2600 and then to the old daily high at 1.2650.

Euro Long Continuation Towards...So coming back after a long break from trading. Today i'm interested in longs on euro so far. I'm staying bullish as long as euro stays above 1.06634. However, I'm looking at two levels to go long on euro.
it's either below the 1st intraday low at 1.06951 or below 1.06609.
I prefer the 2nd low to be taken out before going long as it would have a greater potential to continue towards target 1.0760.

GBP/USD 4H Indicating BearishnessHi traders, it's yet another week and this means fresh opportunities in the majors. Today I bring to your attention the short position I am currently holding on GBP/USD . This pair is currently in a longterm downtrend, therefore the highest probability trades will be found shorting the pair, this frames my bias.
On May 4th the market ran just above the high of April 29th on FOMC volatility , the market then returned below this high, breaking market structure in the process, traders using institutional concepts refer to this as the stop hunt. With this framework, once price returned to the breaker which initiated the stop hunt, I entered my short positions. The stop loss of the trade is placed above the 4H breaker block (the block is represented by the red rectangle ) and my final take profit level is placed at the high of the 4H fair value gap. The level represented by the blue line indicates where I will take my first partial if price moves in my favour. I have selected this level since it is an area of mitigation and so price can bounce from there.
More details of the overall framework of this trade is explained in further detail in my first publication, which can be seen below this publication in the "related ideas" section. I really appreciate you for reading this post and remember, buy/sell at levels that make sense and let the market do the rest.
May the markets be with you.

BTCUSD 30M OBI don´t know if I´ve got a hang of these SMC/ICT-concepts yet, but I felt confident with this one.
