gold did what i said yesterday i mention that gold will likey continue its higher trend and it has done so.
Ictstudent

gold biastaking off partials ahead of news impact driver FOMC and scaling stop lose and managing my risk.

DXY might back into bullish pullback momentum in Jan ?
Expecting some bullish momentum after balancing the displacement below , Next FED Meeting will be at the end of Jan & will start on February 1, 2023 which we must aware of upcoming Rate Decision !

DXY Long BiasHey traders, here is the analysis for the DXY. If you guys like my analysis please hit like👍 and follow. Thanks. DISCLAIMER:- This is not financial advice.

💁♂️ ETHUSDT / 6H Short From 1220/1240 ?🤔 let's see ❗💁♂️ HI Everyone... As you can see, the price has reacted positively to the specified support zone after a 14% correction. Currently, the price is in the suffering range. It is possible that the price will reach the $1220/$1240 FVG range created by the reaction Be positive. For the desired scenario, it is important to maintain the $1150/$1170 range. 💹
Support ranges $1100/$1070 ⚠❗
Resistance ranges $1207/$1220/$1240❗
❎ (DYOR)...⚠⚜
WHAT DO YOU THINK ABOUT THIS ANALYSIS? I will be glad to know your idea 🙂✌
IF you like my analysis please LIKE and comment 🙏✌

The market is soon heading to a discount. So that major drop last week was something. This really is a guess but I think the currency pair has one more sell off before the market reevaluates its position. From the fib retrace that I did it looks like the market is about to be extremely overbought soon and I guess when that happens this is when I personally would want to be preparing for a short. Its a big possibility that it can happen on midnight Monday morning but I will have my fingers crossed. It hit my first target on liquidity today. I believe my 2nd target will be hit before the market starts going down. I hope this Idea was insightful! And feel free to say hello! OANDA:USDJPY

EURUSD BREAD AND BUTTER SETUPThe DXY is showing signs of getting back to the races , while the fIber is clearly frail.It has been on a week long consolidation which is likely pointing to the pair distributing to go lower.
Last week price had tapped into a daily rejection block from midyear as well as flashing with another key premium being the yearly low from 2020.These are strong lecvels that are likely going to offer resistance .
From my analysis i took a fib and marked the 50% level of the hourly rejection block for a much refined entry that offers a higher risk to reward ratio.All i have to do now is wait for price to tap into my slaughter house.:-)

sugar long want to see price retrace back into the range to go long and take out the equal highs at 23.80 area

Trading FVG Swept liquidity
Next is smart money trading
Let’s see if price is willing to pullback & touch them reject off that area then continue down.

Retail vs. Smart Money - Truth vs. Manipulation tutorial - *SMT*
SMT= Smart Money Theory. Look at the related idea for a previous tutorial on this. This will be a continuation of that tutorial, how we're taught to trade is manipulation tactics by the institutions, and how to realize whats actually happening.
When I first started, I started to learn how to trade under a an MLM company called iMarkets Live. Some instructors were good and were starting to catch on to what was happening to price action. Others just marked levels,. or tried to use way too many jndicators to find a trade. I ended up losing a lot of money that year because there was no cohesion. I find myself asking "why?" a lot. And if this "Trade the trend is supposed to work so well, why was I getting screwed so bad everytime I went to trade off that trend line. Until I fdinally found the one person who dug deep into the charts and found the truth and I've never seen any other trade get more accurate while trading live.
1. Price is manipulated on every chart. That is their commodity to protect and they'll go down in flames protecting their commodity. Whether that commodity is currency or stocks, there's someone or groups that own enough to control the chart. And that algorithm re-starts everydsay at midnight NY Time. Just before the London session starts
2. The charts above represent what a smart Money Technical Analyst would create for his chart, the second is the retail theory, how your "Taught" to think what tedhnical analysis is supposed to be. Fore example, you would normally out a trendline going down atop the downtrend, and when the price breaks that down trend then you'll told wait for the "Retest" of the price to hit that trend line. But sometimes it doesn't and you've missed your opportunity at a breakaway right? No, you just followed the wrong path on how to read price action. And could've caught that breakaway knowingt that it's not "retesting" the top trendline, instead it's finding the last price that the institutions sold off hard to try and make the retail traders sell as well. Evidently they were successful because the institution then come in and buy it up and a huge discount. And they buy up so much at the start of the run, it breaks the structures previous swing high In fact they probabloy are still holding a short position near that swing high so aftyer it breaks the high and closes above it, it retraces slightly back to the price area of the the previous high. Why? So they can then breakeven on the trade of holding that short while also capitalizing on the long they are taking because of how much of a discount they were able to buy up.
Lets take the current chart for example. When you see the price formation of a low / high / lower low, The last bullish candle in the high formation is now Resistance that will turn Support. I have the Low / High / Lower Low Color Coordinated with it's Breaker Blocks Border or just "Breaker."
As you can see it, each time it breaks the previous structures high (Where I write Break of structure with a line at the top of previous DAILY body that was broke and closed abnove, thje price then slighjtly retreats, back into that High candle's price range, doesn't close below it and then makes another large move to the upside. Its retreating down to a place where they could still be hold a short from the previous quarter (yes, you read that right, they have deep pockets, they can be in the red forever and ity weon't matter, they;'ll manipulate it until they get what's theirs, this is why Larry Williams has 90 day lookbacks in his analysis)
Here's the scary part. Now that you have read that and it seems so obvious and your going "Why was I taught to think about it like this?" (See Next Chart)
I was taught to think of analysis this way, I'm sure you have at one point. When the trendline breaks then we should see a retest and more bullish trend / channel. However, after it breaks the trendline, it didn't retest, neither is it really following the "Channel" it created. It's inside the channel but Following the trend as you would like to see, correct? even if we look a little closer on the 4 hour it looks further off
Why is it not doing exactly as we were taught it should? Because we were taught wrong. Price doesn't know if it's following a channel, it doersn't know if it's creating a Triangle, it doesn't know if it's making a flag.
What does it remember? Price levels. Therefore, the way we were taught was wrong and the correct way to look at support and resistance is actually an area within a price range. Why? As mentioned before, it's the institutions ,manipulating the charts to retreat back to an are to where it may have been holding a short and is now looking to break even while cranking up the long earnings. This is all by design. Now look at the chart again with how I just explained it, look for the break of structure, check for the close above the previous swing high close, then see where the price falls to, check to see if it is within a high of a previous swing high candle. If it breaks lower and closes lower, then we have 1 of 2 things
1) Price could have run into a Bearish Breaker (Where you have a High / Low / Higher High and the Low of that formation is a breaker that reject the price and we could see the price start to retrace lower. or
2) Also Look to see if the Break of structure that was broken has a string of balanced bullish candles to form one large Breaker. If so, the price may look like it is lower than what it should, but still within the breraker. i.e. CURRENT PRICE (see chart)
We have a large breaker if you consider the two balanced bullish candles on the far left. If the are balanced, they act as one candle (Meaning their wicks touch, there's no fair value gap) See Chart -
So I see this as still being within the Bullish vain, and we'll have to see if it's going to keep reaching for the break of structure.
Why is it going tio the break of Structure? That is where the Liquidity is sitting by the retail user and the institutions want to take that liquidity for their own pockets. Howevever, We'll Save Liquidity for Next "Smart Money Knowledge Tutorial"
If you have any questions please shoot them below. I'll do my best to answer. If it doesn't make sense to you and you see a flaw in my analysis, a flaw in my reasoning as to why it would be manipulated, please let me know.
Personally, I like having an answer as to why price does what it does, which is why I am behind the Smart Money theory of Manipulation. It makes way more sense than the previous explanation of "It just breaks trend and will continue in that direction." ..... where I feel "This is the area price was before on a short and the institutions need to break even after blowing past it making profit up to that point"
I hope I was able to break this "Smart Money" theory down a bit further and was able to help make sense of thewe things.l This was inspired by a meme I had seen on LinkedIn of the price running up pasty the break of structure and there's a trendline on top of the rear down slope and the price retests and starts moving up. The meme was based off this with a person almost in tears of joy.
My point? Don't see the price action as a result above. Understand it as this
I went to write my explanation that was a different interpretation and by the time I finished I couldn't find the Meme again. So I felt it was my calling to continue writing a major Smart Money Analysis points that many people need to see and hear.
If you enjoy these explainations of Smart Money, please let me know and I'll continue on a series of these with a point behind each one.
Thank you!
- Bodies X Wix
OANDA:GBPUSD
FX:GBPUSD
CAPITALCOM:GBPUSD

GBPUSD Short Bias Analysis | ICT ConceptsHey traders, here is the analysis for the GBPUSD. If you guys like my analysis please hit like👍 and follow. Thanks. DISCLAIMER:- This is not financial advice.

GBPUSD Short Bias for next weekHey traders, here is the analysis for the GBPUSD. If you guys like my analysis please hit like👍 and follow. Thanks. DISCLAIMER:- This is not financial advice.

💁♀️ BTCUSDT / 1D Exactly as I predicted! ✅ UPDATE💁♂️ HI Everyone
As you can see, The price is from the range of 18,200 mentioned in the previous analysis. It was accompanied by a negative reaction. If the range of 16,500/16,300 is not maintained, further correction is possible.
Long term support ranges $14000/$12000/$11000⚠❗
❎ (DYOR)...⚠⚜
WHAT DO YOU THINK ABOUT THIS ANALYSIS? I will be glad to know your idea 🙂✌
IF you like my analysis please LIKE and comment 🙏✌

GBPUSD Short Bias from 1h FVGHey traders, here is the analysis for the GBPUSD. If you guys like my analysis please hit like👍 and follow. Thanks. DISCLAIMER:- This is not financial advice.

GBPUSD Long BiasHey traders, here is the analysis for the GBPUSD. If you guys like my analysis please hit like👍 and follow. Thanks. DISCLAIMER:- This is not financial advice.
Will bias be Bearish for Tuesday?Hello again Everyone!
Im here to kinda give my take on the market and to see if anyone can relate if not its okay we are all here to share ideas on the market so I'm open to other perspectives. I am a ICT student so a lot of my technical analysis theories do originate from him. Just wanna put that out there. But I have been watching this pair well, for the sheer reason that this is one of the 3 that I primary engage in. what I have noticed is that there was a large imbalance on the daily timeframe. Once that happened there was a retrace into the FVG (Fair Value Gap) Since the FVG was on a daily time frame it looks so large in this chart but you can see that price has worked its way through it nicely. Before midnight New York time it has traded above the FVG. What I am looking for is the market to either trade higher and then shift or it could likely shift and start going lower I have Mondays open price at midnight annotated to show how far price has gone and what I can potentially see going into New York session. If there is a structure shift I will be hoping to participate in some shorts since my overall bias is bearish. at least for Tuesdays trading day. I haven taken into account of any news that could affect volatility as of yet which I will do when I finish posting this but I have a strong feeling prices can drop going into London session and continue into New York for Tuesday. We shall see! OANDA:USDJPY

XAUUSD wait for the breaker (Dec 12th 2022)This week the price is still at the old high of the previous range. Last week it made an equal high which can be pooling for liquidity.
Now I expect the breaker pattern form to return to the SSL the market had made down there.
The hunt is on if there is a displacement through the last swing low!

Day Trade on APEWe are heading toward the daily order block on the APE chart. If I get a good rejection I will be shorting APE.

💁♂️ IOSTUSDT / 12H 💁♂️ HI Everyone...
As you can see, the price is currently in the range of 0.00858.
If the price stabilizes above the range of 0.00874, it is possible to have a positive reaction up to the range of 0.00899 / 0.00928, otherwise price correction 💹
Maintaining the range of 0.00840 is important for a positive trend ❗️ ⚠️
❎ (DYOR)...⚠⚜
WHAT DO YOU THINK ABOUT THIS ANALYSIS? I will be glad to know your idea 🙂✌
IF you like my analysis please LIKE and comment 🙏✌

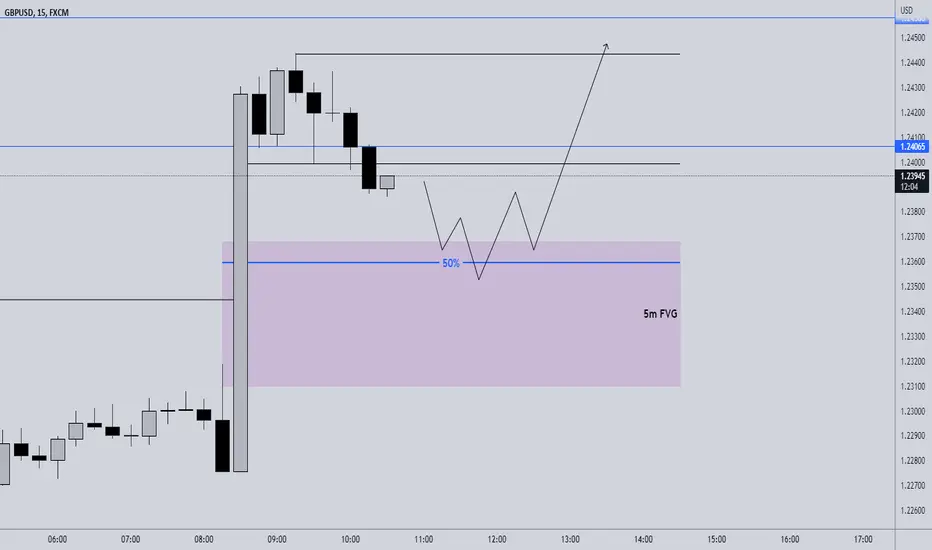
GBPUSD - HTF Continuation trade long setup - ICT ConceptsI set the buy limit on the 15m FVG but it didn't get hit and also missed the next 4h FVG entry. Then I entered a buy trade on the 1h FVG and closed it with 3.4%.

an observation on oil As you can see, I marked the return points on my 15min chart, Every time price goes to the order block and rejects. I'm going to put a short order like this!

GBPUSD Short Analysis - ICT ConceptsHey traders, here is the analysis for the GBPUSD. If you guys like my analysis please hit like👍 and follow. Thanks. DISCLAIMER:- This is not financial advice.

my Idea About Gold Spot My Analysis shows that Gold Spot (XAU) will have some movement to the upside and those key levels and will be ready to open some short position!
