Gold Bullish AnticipationPrice is currently in a weekly Fair Value Gap (BISI) and has not fill the sell side inefficiency completely. Expecting price to fill the imbalance down to 1870 which is also a weekly reclaimed OB, thereby taking out June low (sell side liquidity) before making moves higher to 2080 and clearing the monthly buyside liquidity.
Ictstudent

XAUUSD (GOLD) Analysis for the week of July 2, 2023. Gold has been in a solid consolidation for almost 3yrs now, with slight deviations outside of that range, nevertheless alway coming back into the range. Currently Gold has swept long term highs taking buy side liquidity...coming back into the range off those highs. My macro conviction is that Gold will now begin to draw towards sell side liquidity, which means a draw towards lower prices. So from a monthly standpoint Gold is bearish.
From a weekly standpoint gold has just taken sell side liquidity in the form of drawing into a longterm Buy Side Imbalance Sell Side Inefficiency or Weekly FVG (Fair Value Gap). Price have currently reacted from the consequent encroachment (midpoint) of that BISI, and it is my conviction that we are seeking higher prices and drawing towards buy side liquidity to basically get inline with the monthly bearish direction.
From a daily standpoint gold has left behind a pretty obvious SIBI (Sell Side Imbalance Buy Side Inefficiency in price. It is my conviction that the strong Morning Star Candle stick pattern is a form of confluence that price is indeed drawing towards buy side liquidity, to ultimately get inline with the monthly bearish direction to finally breakout of this longterm consolidation and begin to seek longterm sell side liquidity. Please view the video to get a more detailed top down explanation of what I'm mentioning here. If you you have any questions, please don't hesitate to ask buy leaving your comment in the comment section below. Thanks.

EUR/USD SHORTI believe that the weekly, H4, H1 timeframes are in alignment. the weekly range has a potential of filling the imbalance in the market.
Practicing a strategy.
OANDA:EURUSD
1. MSS
2. FVG
3.Imbalance

Smart Money Buys Red CandlesWhen you understand that trading is all about going against the herd then you will become a Profitable Trader.
Welcome to the 5% club!
#SniperGang
Never over Leverage.
Trust your trade set up.
Have a Great Weekend!!!!

Unexpected Daily Choch EU UpdateThere are lots of things that can happen now. Best to keep expectations of where price could go to a reasonable level. IMO unexperienced traders should only target weak structure points and not liquidity points as those might not be taken, but I leave that decision to you.
Waiting for more information on Monday and Tuesday for a follow up analysis but for now best to target weak 4H structure points

EURUSD sell continuationHello Traders,
On the Daily timeframe, EURUSD has shown signs of exhausted buyers and has been creating lower lows since Friday.
I believe the price should continue going lower to fill the price imbalance below.
Good luck. Trade responsibility.

I hate to be a retracement artist...I hate to be a retracement artist, but there are some cinditions that can offer us a gain.
Tuesday LKZ High
Buyside liquidity hit
Retracement comes after expansion
Daily Rejection Block
Take partials are already marked out at opposite short term PD Arrays
Anyone else have the Outlier Perspective?

BEARISH IN DXYMy overall bias is bearish for the short term. I believe I will get a good entry in EURUSD when the price reaches the BSL (BUY SIDE LIQUIDITY) at 105.895. The order flow is also bearish, indicating a higher chance for DXY to be bearish and other USD pairs to be bullish. This is basically my insight only.
Have a wonderful trading week!
MMTrades

NZDUSD Will Ride Long?Cause of the possible bullish run for next week: mitigation of weekly FVG (a little bit below Equilibrium at discount)
Trend: Bullish as price has broke structure up (ChoCh)
Stage: Expansion but expecting a retracement into either the 1hr FVG or extreme FVG that will trigger a possible long opportunity.
What will cause this retracement is the mitigation of that ob in which price is within.
Time frames analysis (for setup identification and entry.)
On daily TF, the weekly FVG (first DOL) is more pronounced. So, I have a confluence there.
On 30min, Price is within a bearish OB that should cause the retracement I'm looking for (screen can't cover it but it is to the left side if you go to the chart).
Some people will short the retracement but I don't feel like yet as price might not retrace if it likes.
Those FVGs are either levels where I'm looking for a buying opportunity. I might decide to divide my risk since I have two possible levels. 0.25% for each if I'm risking 0.5% per day or 0.5% for each if I'm risking 1% per day.
(Another alternative is to go with a confirmatory entry). Anything more than two possible OBs or FVGs, I'm not working with it. I'd consider that multiple levels with a low probability setup.
All for educational purpose.😄

Buying Trend Continuation on CHFJPY. The Swiss Franc/ Japanese Yen pair appear to be on a strong bullish direction since September 2016. However, since January 2023, we can see a steeper and stronger bullish pressure on the pair.
The CHF/JPY pair is currently trading in a swing Premium level, and has been for months, but while we predict that the pair should sell, Fundamentals has also been adding to the massive gain in the CHF pair. Our confluences for a Bullish trend continuation include:
1. HTF bullish trend.
2. FVG range (146.402-149.287) is unbroken, but instead acts as a SUPPORT LEVEL.
3. Price hasn't still reached our main Point of Interest (POI, which is at 158.520).
4. Price is currently at Equilibrium on the Daily chart.
Therefore, we are expecting a consolidation on the 50% level, before an expansion towards 155.583. Let's be expectant between today and Friday.

AUDUSD: Buy/Long AUDUSD is weekly discount zone
Showed good bullish reaction from daily fvg (that was formed on 9th nov, 22), with upward displacement and MSS on multiple timeframe (1h, 4h & 1D)
left behind untested/unmitigated FVGs on multiple timeframes and also nested into htf fvg, to be rebalanced soon.
there is also a 1H bullish breaker block aligned with the 50% of current bullish PA.
my entry would be 50% of bullish breaker and stops below same 1H bullish breaker.

Analyse of The S&P 500 Hello Folks.
The S&p 500 just breached the high at4227.25 of the candle of 19 May and rejected the Monthly C.E of the wick of the august candle, if the price retarce to the daily FVG showen here and find support at it i think that the high 4243.25 could be taken. if the price didn't respect the daily FVG and passes trough it i will treat it as a IFVG and i will look to take the Weekly SSL at the low 4114.00.
im open to all new idea and criticisms in the comment section

GBPUSD shortrecently developed this ICT Silver Bullet tool and was amazed by the results.
2 trades on GU using M1 with a 1:1 RR of 20pips. On a big funded account, results could potentially be huge.

IPDA on EURO FUTURES CONTRACTSellside and Buyside Have both been Purged Since the New Yearly Open with price Resting at the Midpoint of the overall Neutral Order Block we are currently sitting inside of. I am Neutral Until I see a significant Displacement Leg Form; Shifting Market Structure to a More High Probability Setup. For now I will Simply use the Weekly Range(s) of Liquidity on a Daily TF to Locate 4H Swing Highs/Lows for 1H Model Frameworks - allowing LTF 5min 3min 1min Entry Setups At HTF and MTF PD Arrays. Running sentence, sorry. #ICTStudent
** NOTE: Even though Long Term I am Neutral - I am Bearish on the Short Term till price Reacts off of the Bullish Breaker, because we are in a Bearish Weekly Candle with a confirmed Daily Swing High for Monday, Tuesday, and Wednesday that has drawn a Daily Bearish FVG.

NZDCAD short Price has pulled back to the level of interest from last Friday. Reached and currently trading into 4h fvg and below 4H order block.
Will let the asian session unroll and see where we are at tomorrow morning 7am.

EURUSD Shorts Eurusd possibly selling short during London Sesh... We see a 5m SSL Purged & Reverted back to the upside to take out the 15m BSL that's been Liquidated. Price will go into the OB- & head to the downside to take out the 15m Sellside Liquidity.

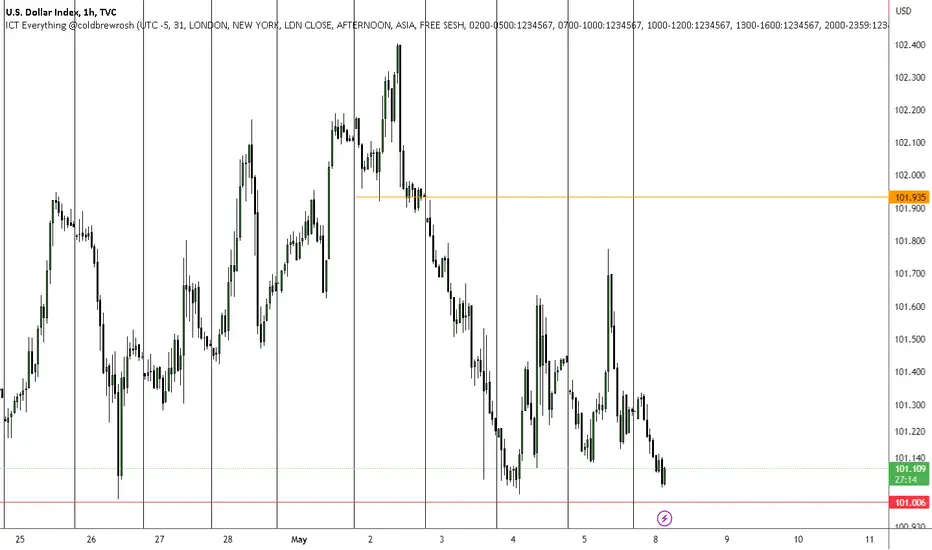
BUY DXYConfirmation
• Sell-side liquidity taken out.
• Break in Market structure.
Entry
• At FVG
Target
• Above 101.400
Good luck.Trade responsibly.


Super Bearish on Dollar ($DXY) BUT... I wouldn't be surprised...TO SEE A RETRACEMENT...
Small bullish retracement can be "felt" due to a "feeling" of:
sell-side liquidity being hit - potentially during killzones - on a notorious Tuesday (reci [pe for some action)
Orange MLV is a target.
I shouldnt be trading lol but..Yeah you'd be crazy to trade NFM and Interest rates... but this looks like a nice sell ;)

EURUSD Breakdown 1HRAfter having a High momentum Push down yesterday we see market moving upside in a low momentum so we expect sells highly to come in after filling the 1HR FVG and also taking out the BSL, So after taking out all those we wait for 1M Market shift and another BOS for 2ND Entry(Low risk) We SELLS
