Icx


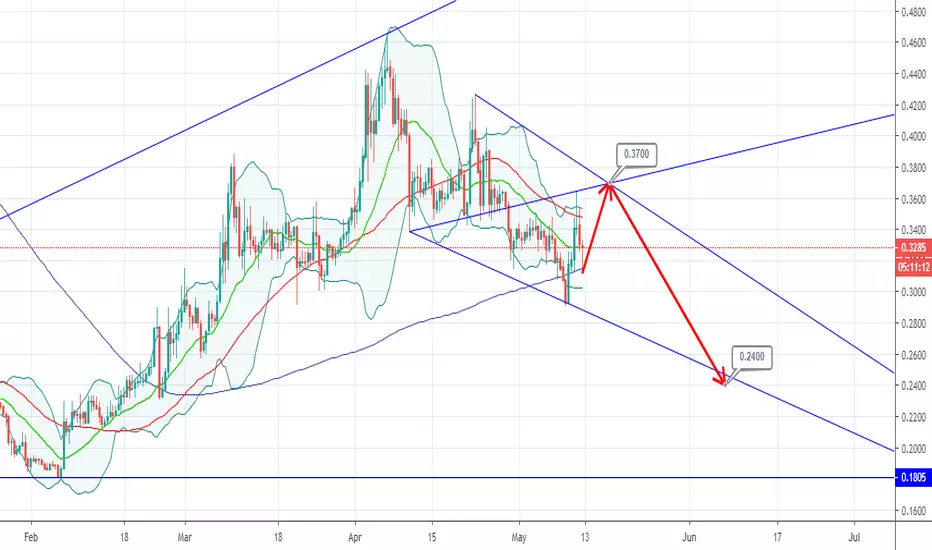
ICON/Tether #ICX $ICX #USDT $USDT (13 May)ICX is in small uptrend in small timeframe with BTC direction. However, it still seems too early for ICX to be able to increase strongly at this time. In my opinion, ICX can reach 0.37$ in this wave and will fall deeply to 0.24$ and this is the best buyzone for holding long-term
If you don't have ICX yet and want to make a small profit in this wave, you can buy close as 0.32$ as possible
Stoploss if ICX falls out of this forming Falling Wedge area
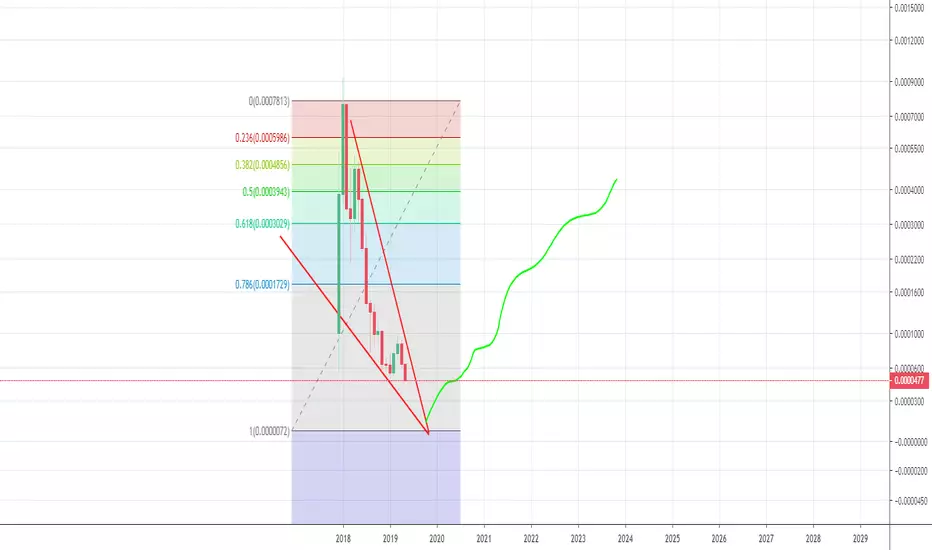
ICX Retracement Wave 1 Complete #ICON #ICXUSD #ICXUSDT #BINANCEThere was that break i was looking for above D wave of the diagonal. Count was 5 waves up to complete 1 wave now looking for a pullback to the top of the diagonal around the golden fib zone .618-.65.
Cheers,
Marc

UCX Target 1 confirmation #ICON #ALTCOINS #ICONtarget reached of .30 now up by .04. Expect a test of the diagonal here but being cautious as we may see some downside on bitcoin
Marc

ICX Target 1 Reached #ICX #ICON #ALTCOINSTarget 1 reached waiting for confirmation here but looking like a good entry. Remember that C wave can extend beyond 1:1 so blind entries here are not a good idea IMO

$ICX - LONG - 1D - TRADE IDEA- Watching for reclaim of Daily OB
- Volume decreasing during the end of this sell off, hopefully we are just dipping under OB to remove stops and then reclaim
- Want to see FEB lows NOT BROKEN below 537 SATS but could see it act as the support before the reclaim
- Take profits @ 675, 801 and finally between 900 to 980
- Korean Etherum


$ICX Reaching ATL BTC Support at ~5.7k sats...$ICX Reaching ATL BTC Support at ~5.7k sats...
UCTS Sell signal active since March 21th with a 27% drop since that moment..
If we look previous iterations with this level, we can expect a bounce to happen, but please wait for signals of that happening.
#ICX

ICX/BTC - RIPICX/BTC looks to have made a lower high and is back in a bear channel .
Blue triangle indicates the current range.
Green box is buy.
Red box is sell.
Blue line indicates potential support/resistance .
Green line indicates t/p.
This is a log chart.
This chart is made using fib channels.
This is not financial advice. All charts shown on my page, including this one, are just for fun.
If you enjoy my ideas please give this post a like and follow my page if you would like to see future posts! :)

ICX Target 1 .30 #ICON #ICXUSDT #ICXBeen on this count for a while still not 100% sure but based on this i see .30
Cheers,
Marc

$ICX long for one month, a visit to 1000sats This play relies on BTC going to the top of its falling wedge around 5k which seems possible with the current trend.
Entry: around 680
T1: 760
T2: 840
T3 1000


ICON High Volume Breakout Shows Potential For MoreOn early February 2019, ICON (ICXBTC) started its first strong bullish wave since the last cryptocurrency market bull run back in late 2017 / early 2018.
This wave generated over 89% profits from bottom to top and ended on the 10 March with a peak at 0.0000990... ICXBTC has been retracing since.
Yesterday after 42 days of retrace a big green candle showed up. This candlestick managed to break above EMA10 with good volume and also challenged EMA50 and EMA100.
Both the MACD and RSI look healthy for additional bullish action.
On the other hand, a close below 0.0000730 can turn this set up from bullish to bearish. And a close below 0.0000660 would completely invalidate all of the above signals, a new analysis would be needed.
So ICXBTC is looking bullish with room to continue moving up. Depending on how the market/Bitcoin moves, this altcoin also has the potential to break its last high relatively quickly, in a matter of weeks.
Feel free to hit like now if you want to show your support.
Thanks a lot for reading... This is Alan Masters.
Namaste.

$ICX Crossing over resistance at ~700sats...$ICX Crossing over resistance at ~700sats as result of the "P-Rep TestNet" announced for April 30th.
If current level hodls, potential next resistance/target could be around 900sats
UCTS Buy signal on the 12H
RSI & MACD rising
Bullish divs
ABCD bullish pattern in play
#ICX

ICX-BTC Double Bollinger Bands The Double Bollinger Bands on ICX-BTC pair are now in the neutral zone again. Pay close attention to the price action at the middle BB (blue line in the middle). We will update the post once we see where the trend is going and provide you with a RRR setup. At this moment we are neutral and are waiting for price action on the BTC pair, however if BTC makes a move we will be waiting even longer to figure out where this is going.
A close below the middle BB will suggest that the downtrend is likely to continue. A strong close above the middle BB tells us that we are likely going to reverse the trend or at least touch the 1st or 2nd upper zone of the BB.
Extra info:
Green zone = bullish trend
Blue zone = neutral trend (break up or down this zone might indicate reversal)
Red zone = bearish trend
To be updated!!!


ICX Trading Opportunity ICX Forming Bullish Flag Pattern as per Chart
we have a good buying opportunity
BUY ICX Between 700-715
Target 800
Target 900
Target 980
Target 1115
Target 1260
Target 1470
Target 1730
Stop Loss 660

ICX Target .31 #altcoins #bitcoin #crypto #icon #icxTarget area .31. working on wave 5 sub-wave 3 of 5
Cheers,
Marc

(ICX/ USDT) 30% drop ahead to 0.29ICX has been in an upward channel these past few weeks and with BTC breakout helped extend this move. As we broke down out of our channel and our fork tonight this is where we stand and our targets ahead.
Everything here is what I see. This is never financial advice trade wise.
