Bulls have held the market, we are preparing for new heightsWe are very close to the middle of the quarter, let's look at the market situation. On average, the movement after the opening of the month is within the planned plan with a target at the retest of 2600-2750 and likely attempts to continue the trend at 2900-3250-3500 due to the positive closing of last year. Against the background of the addition of strong statistics on the dollar and its strengthening, the growth of the crypt turned out to be slower than we would like and 2500 was taken not by the end of the month, but only by the middle of the quarter. This is partly a positive factor for the formation of a stable trend in the average market.
To date, the opening of the second half of the quarter above 2600 is enough to maintain the market. Further, the probability of attempts to gain a foothold in the range of 2750-2900 prevails before the end of the month. However, we can expect an increase in bear activity aimed at reversing the current monthly candle and returning the price below 2500 at the end of the month, which will increase volatility and market disruptions at the change of weekly candles. Today, the bears have once again declared themselves by giving powerful statistics on the dollar, but I think the level of 2600 will stand, in which case we can see the first breakdown of 2750 by the end of this week. If the price goes below 2600, there is a chance of a test of 2500 with a payback by the end of the week. Basically, the most important point will be the approach to the end of the monthly candle, where a strong blow from the bears can be expected, fixing above 2750 by that time will give a technical signal to continue purchases and will significantly reduce the number of sellers.
For the violas, the market remains very dangerous for now because the cue ball has not reliably fixed 50k and the ether has not taken 2750, however, the very fact of a breakdown of 50k and 2500 already gives a technical signal to maintain purchases and a reaction follows on the violas, which gradually prepare the ground for breakouts. If the alt levels taken by the tops are retained, the probability of a bull run at the change of the month will increase.
I am still considering vib cvp drep ooki oax asr atm, which have not fulfilled their technical goals up to 100%+ of current levels. There have been significant impulses for a trend reversal and a return to growth for drep and vib, while the rest of the coins are trading near supports in anticipation of a suitable ground for growth. Stronger gft and df coins are well suited for medium-term investments.
Id

COTI CHART ANALYSIS: HEAD AND SHOULDERS BREAKOUT?In this chart of BINANCE:COTIUSDT , observed a head and shoulders pattern and for the past 3-4 days, the price of COTI rose to more than 50%. As the thumbnail shows, the pattern had a breakout. Will it surge continuously, go sideways or maybe a reversal? I will provide updates on my full chart analysis in the threads below.
Happy trading to everyone and a Happy Chinese New Year :)

ID ADX Breakout Before Price Breakout Channeling upThe MACD Signaled a Buy with the EMA Crossovers happening above the Signal Line.
We're Channeling on the 1.0 and 1.618 fib showing bullish Strength.
We can see before ID Broke out almost 100% the ADX Broke out a Resistance Line and is Now Channeling Upward
Below is the Call that Made ID Catch my Attention
🔎 *Symbol*: `ID/USDT`
📈 *Signal*: `Long`
💲 *Current Price*: `0.61248`
🛑 *Stop-Loss*: `0.18023112000000002`
💰 *Market Cap*: `286793089.6509273`
🚪 *Entry Prices*:
📥 Entry Price 1: `0.36552888`
📥 Entry Price 2: `0.42284556000000006`
📥 Entry Price 3: `0.46917000000000003`
📥 Entry Price 4: `0.51549444`
🏁 *Exit Prices*:
📤 Exit Price 1: `0.8154255600000001`
📤 Exit Price 2: `0.90807444`
📤 Exit Price 3: `1.05804`
📤 Exit Price 4: `1.2080055600000001

ID's Situation: What Shall we Expect!IDUSDT has Created a Large Rounded Bottom. This Means The Price Can Increase as Much as the Length Between The Top and The Bottom Of the Rounded Bottom. Since there are no Break out, There is no Confirmations So we must Wait for Confirmation of a Bullish Trend .
_ _ _ _ _ _ _ _ _ _ _ _ _ _ _ _ _ _ _ _ _ _ _ _ _ _ _ _ _ _ _ _ _
🤑Stay awesome my friends.
✅Thank you, and for more ideas, hit ❤️Like❤️ and 🌟Follow🌟!

ID/USDT What a significant movement! Continue break or reject??💎ID has recently exhibited notable market dynamics, particularly as it confronts the challenging combination of the Bearish OB and a robust supply zone following an impressive surge of nearly 100% within a single day.
💎 Should ID successfully breach this formidable area, it could signal further upward momentum, probability leading to the attainment of our target in the bearish OB zone.
💎 Conversely, if ID falters in its attempt to overcome this strong supply barrier, a rejection could occur, prompting a downward trajectory. In such a scenario, the price might retreat to the demand area around 0.392.
💎 Within this demand zone, there exists the potential for a rebound, propelling the price back upwards to establish new momentum and potentially break through the formidable supply zone.
💎 However, failure to rebound from the demand area, and subsequent breakdown, would be unfavorable, signaling a return to downward movement with the price likely descending further towards the support level or possibly even lower.

IDUSDTBINANCE:IDUSDT Long idea
⛔"Daily crypto market analyses I provide are personal opinions & not financial advice. Trading carries risks, so do your own research & seek advisor's help. #DYOR
Don't forget to 🚀 and comment

IDUSDTBINANCE:IDUSDT Long idea
⛔"Daily crypto market analyses I provide are personal opinions & not financial advice. Trading carries risks, so do your own research & seek advisor's help. #DYOR"
Don't forget to like and comment.

ID/USDT upward momentum? 👀 🚀ID Today Analysis💎Paradisers, direct your attention to #IDUSDT as it exhibits a compelling pattern. The asset is making an attempt to overcome a bearish Order Block, indicating a potential upward movement if it successfully breaks above.
💎#SPACEID has adhered to a descending channel pattern, breaking above it to embark on an upward journey. Currently, it's gaining momentum for another attempt to move past this bearish OB. If this breakout is maintained, it significantly increases the prospects for a bullish movement. With this ongoing upward momentum, AMEX:ID is targeting the resistance level at $.53282.
💎 For #ID, it’s crucial to be prepared for a potential bullish recovery from the support level of $0.22143. However, a descent below this level could indicate challenges in sustaining the bullish trend.
💎 In this fluid and constantly evolving market environment, strategic insight and informed decision-making are essential. Crafting a comprehensive trading strategy, inclusive of sound money management and a deep understanding of support and resistance dynamics, is crucial for achieving successful trading outcomes. 🌴💰

ID/USDT In the Key area level. Break the resistance or Rejected 💎 ID has indeed emerged as a standout in the market, showcasing a robust rally from $0.172 and skillfully navigating a breakout from the descending channel pattern. The chart underscores a valid retesting phase, suggesting that ID is poised to sustain its upward momentum. However, a significant hurdle remains, as ID grapples with a formidable resistance area—a historical point of retreat. Overcoming this barrier is essential for continuing its bullish journey.
💎 Should ID falter at this juncture and fail to conquer the resistance, it might retreat to the safety of the demand area, gathering strength for another attempt at ascent. Conversely, a successful breach of the resistance zone, probability could set the stage for a smooth sail towards the next station, notably the supply area.
💎 Yet, the market is fickle, and a less optimistic scenario exists. If ID retraces its steps to the demand zone and, crucially, fails to preserve its stance above this crucial support, it could unravel a bearish turn. This downturn would see ID seeking deeper solace, potentially at a lower support level.
💎 Here, it would need to muster significant rebound strength or risk a further descent to even more foundational support zones, highlighting the precarious balance between bullish aspirations and bearish realities.

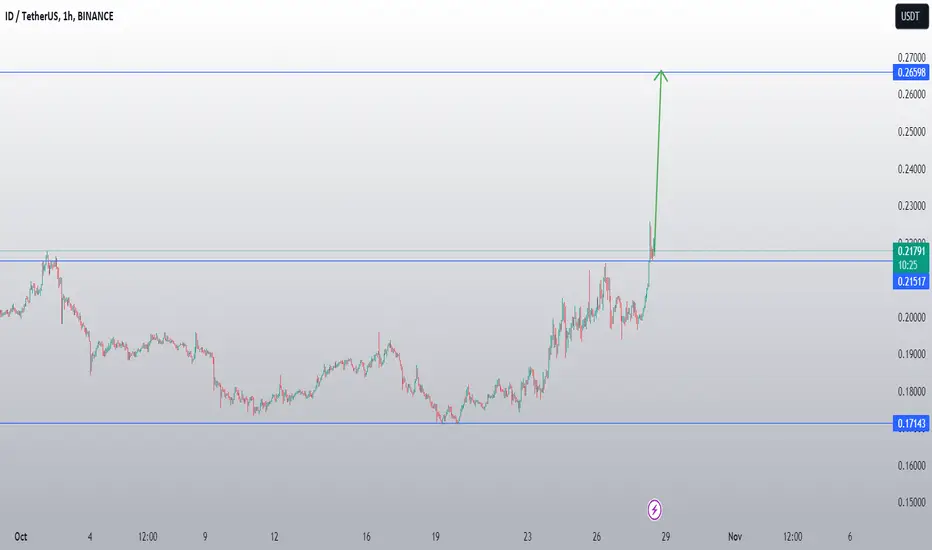
ID CONFIRMS NEW VOLUMEID seems to confirm the new volume.
Today and the coming days can be important.
ID/USDT - Space ID: BBand_Breakout◳◱ A Bollinger Band breakout has been identified on the AMEX:ID / CRYPTOCAP:USDT chart, as the price has breached the upper Bollinger Band. This occurrence suggests the emergence of a potential bullish trend. Noteworthy resistance levels can be observed at 0.1952 | 0.20804 | 0.23303, while significant support zones are located at 0.17021 | 0.15806 | 0.13307. It is advisable to contemplate initiating a buy position within the present price range of 0.21979 with the objective of attaining higher price levels.
◰◲ General info :
▣ Name: Space ID
▣ Rank: 284
▣ Exchanges: Binance, Kucoin, Bybit, Huobipro, Gateio, Mexc
▣ Category/Sector: N/A
▣ Overview: Space ID project overview is currently unavailable. I'll try to update this in the upcoming analysis.
◰◲ Technical Metrics :
▣ Mrkt Price: 0.21979 ₮
▣ 24HVol: 8,865,961.958 ₮
▣ 24H Chng: 10.204%
▣ 7-Days Chng: 22.54%
▣ 1-Month Chng: 11.16%
▣ 3-Months Chng: -12.35%
◲◰ Pivot Points - Levels :
◥ Resistance: 0.1952 | 0.20804 | 0.23303
◢ Support: 0.17021 | 0.15806 | 0.13307
◱◳ Indicators recommendation :
▣ Oscillators: SELL
▣ Moving Averages: STRONG_BUY
◰◲ Technical Indicators Summary : BUY
◲◰ Sharpe Ratios :
▣ Last 30D: -22.80
▣ Last 90D: -18.61
▣ Last 1-Y: -17.35
▣ Last 3-Y: -18.15
◲◰ Volatility :
▣ Last 30D: 0.38
▣ Last 90D: 0.55
▣ Last 1-Y: 0.85
▣ Last 3-Y: 1.28
◳◰ Market Sentiment Index :
▣ News sentiment score is N/A
▣ Twitter sentiment score is 0.74 - Bullish
▣ Reddit sentiment score is 0.52 - Bullish
▣ In-depth IDUSDT technical analysis on Tradingview TA page
▣ What do you think of this analysis? Share your insights and let's discuss in the comments below. Your like, follow and support would be greatly appreciated!
◲ Disclaimer
Please note that the information and publications provided are for informational purposes only and should not be construed as financial, investment, trading, or any other type of advice or recommendation. We encourage you to conduct your own research and consult with a qualified professional before making any financial decisions. The use of the information provided is solely at your own risk.
▣ Welcome to the home of charting big: TradingView
Benefit from a ton of financial analysis features, instruments and data. Have a look around, and if you do choose to go with an upgraded plan, you'll get up to $30.
Discover it here - affiliate link -

id analysis (6H TF)After completing the large A pattern, we seem to have entered a diametric diamond pattern.
The recent upward movement seems to be of the same diametric for wave D, that is, the diametric of wave B is large.
In the red area, it can be rejected downwards.
We can look for sell/short trades in the red zone
Do not enter any position without setting stop and capital management

BTC / RNDR / ID / ASTR = coin analysisif you like the idea, please "Like" it. This is the best "Thanks!" for the author 😊 P.S. Always do your own analysis before a trade. Put a stop loss. Fix profits in installments. Withdraw profits in fiat and please yourself and your friends.

ID coin is on the long list with the level of 0.021976Hello everyone!!!
AIHermes today identified the coin ID on the long list with the level of 0.021976
Entry model - breakout! Leverage 10-20X
Stop is short.
We see a long accumulation and a gorgeous squeeze!
1st target 0.2349
Trade with us, trade better than us!
Today:
17 coins on the long list
11 coins on the short list.
Lead in the short zone.
The full list of coins is delivered by our bot every day at 9.00 am

#spaceid #id next levelA nice looking bullish falling pennant in STF. 3rd wave is loading, if #btc allows..
NOT FINANCIAL ADVICE.

Id Getting Ready For 120%+ Bullish Rally Seems Like Getting ready for massive bullish rally
Formed & Trying To Clear Falling Wedge In Daily Timeframe Incase Of Breakout Expecting 120 -130% Bullish Rally
Keep eyes on for breakout incase of successful breakout will look for buying opportunities

ID/USDT is Primed For Bullish Rally | ID Analysis Today💎Heads up, Paradisers! ID/USDT is currently navigating a pristine descending triangle, and it's all set for a potential bullish breakout.
💎Several days ago, ID/USDT masterfully interacted with a bearish Order Block (OB), established matching highs, and set off on a downward course to address the Bullish OB and secure buying liquidity.
💎If the price successfully pierces through the triangle's upper edge, it's likely to engage the looming supply zone. However, let's not forget the wild card—market uncertainty, which could tip the scales at any moment.
💎We're bullish on the likelihood of the price revisiting the supply zone, thanks to residual liquidity.
💎Keep those charts updated and stay tuned for more insights! Happy trading!


ID/USDT LongDirection: LONG
ENTRY: 0.204 - 0.217
OTE: 0.212
TARGETS
Short Term: 0.219 - 0.222 - 0.225 - 0.230 - 0.238
Mid Term: 0.252 - 0.280 - 0.310 - 0.360
STOP LOSS: 0.1959

ID ANALYSIS (4H)By maintaining the two green lines, it can go to TP 1 and 2. When you reach TP1, put a stop on entry and save some profit
I specified the invalidation level

🔥 ID Bullish Break Out After Months Of SellingIf you enjoy this analysis, please give it a like and a follow.
ID is one of the newer tokens on Binance. At the start of the listing it showed some strength, but has sadly been selling for months at this point.
However, ID has broken out of a one month downtrend by breaking through a diagonal resistance line, see chart.
My assumption is that, with some luck, we can at least get back to the May highs. For an optimal risk-reward I'm betting on a reversal in the short-term, but not below the most recent swing lows of around 0.248. This results in a very good risk-reward of well over 22.

IDUSDT Falling Wedge!IDUSDT Technical analysis update
Buy zone : Below $0.253
Stop loss : $0.239
Take Profit 1 : $0.265
Take Prfoit 2 : $0.285
Take Profit 3 : $0.312
Thanks
Hexa

SPACEID IDUSDT Price analysis (4h)Hey, fellow traders and investors! 🤝 Let's dive into the price analysis of SPACE ID! 🚀🌌
📉 Currently, SPACE ID is consolidating in a semi-Triangle, semi-Wedge pattern, creating an interesting setup for potential trades. 🔄 Trading this pattern might be a bit tricky, but don't worry – we've got you covered! 🔍
🚀 Despite the consolidation, the price appears to be oversold for this local period, hinting at a potential weak breakout to the upside in the coming days. 📈 Our targets for the breakout are set at $0.28, $0.30, and $0.32 resistance levels. 🎯
💹 Overall, the trend for IDUSDT seems bearish, and there's a possibility of it reaching another lower low around $0.15. This zone could be a strong buy area for those looking to catch a potential price reversal. 🛒📉
Keep an eye on the price action of SPACE ID, practice risk management, and always be prepared for any market fluctuations! 🚀💹✨
Remember to stay informed, practice sound risk management, and always be prepared for market fluctuations. Happy trading! 🌌🚀
