EURUSD BUYING CORRECTION AND SHORTThe price is now at a strong support level and if it can be a double bottom it will retest the descending channel line and reach the orange resistance, but in the general direction the price prefers to fall due to breaking the black uptrend line. We also have a more beautiful scenario, which is if it can break the strong support we will go with the downward trend.
IDEA

Gold: final pullback or bull trap?On the 1H chart, gold (GOLD) is forming a bullish flag after a sharp decline, which may just be a corrective move within a broader downtrend. The price is now approaching the key resistance zone around $3313–$3317 - this area holds the POC, broken trendline, and the 0.705–0.79 Fibonacci retracement from the last drop. This is the decision-making zone.
If bulls fail to push above it, we expect a move down toward $3268 - the next strong support and potential buy zone, also confirmed by Fibonacci and local demand. Stochastic divergence and slowing volume suggest a possible rebound from that level. However, if the price breaks and holds above $3317, this would indicate a local trend reversal, with targets at $3333 and $3374.
Watch the $3317 zone closely - bulls have yet to prove this is more than just a bounce.

NZDUSD BUY SETUP LOOOOOOOONGHELLO
we have demand and ascending channel 4h
and low time frame the price make engulfing candle on 30m 15m on support zone
and can't make lower low so i will buy it

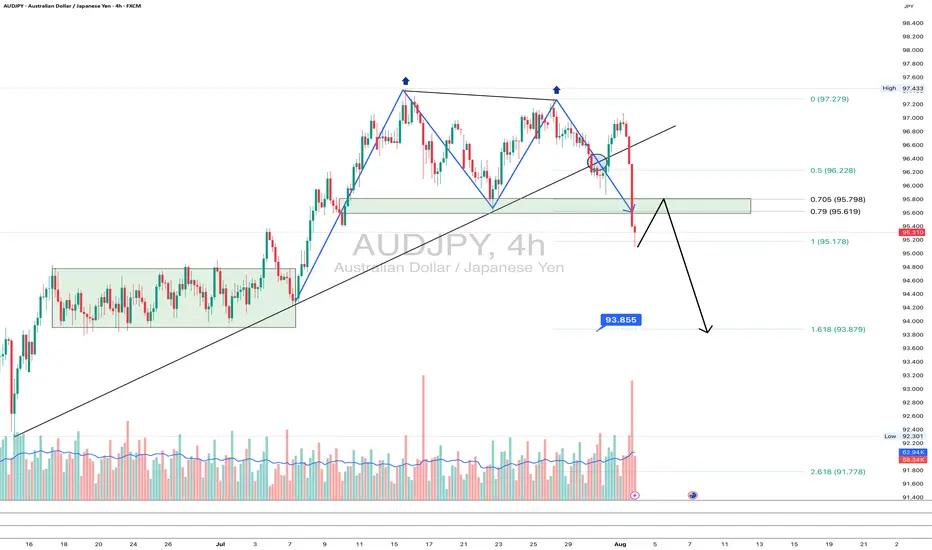
AUDJPY: goodbye uptrend?On the 4H chart, AUDJPY has printed a textbook double top pattern, breaking the rising trendline and diving below the 95.6–95.78 support zone - now acting as resistance. The pair is currently retesting this zone from below, which often provides a clean re-entry point for bears.
This area also aligns with the 0.705–0.79 Fibonacci retracement, reinforcing it as a key resistance. If the price rejects this zone, the next target is 93.85 (1.618 Fibo projection), followed by 93.25 and potentially 91.71 if momentum strengthens.
Fundamentally, the yen gains strength on risk-off flows and diverging rate expectations, while the Australian dollar is pressured by falling commodity prices and a likely pause from the RBA. This widens the rate differential and weakens AUD.
As long as price remains below 95.78, sellers are in control. Watch for a rejection from this retest zone.
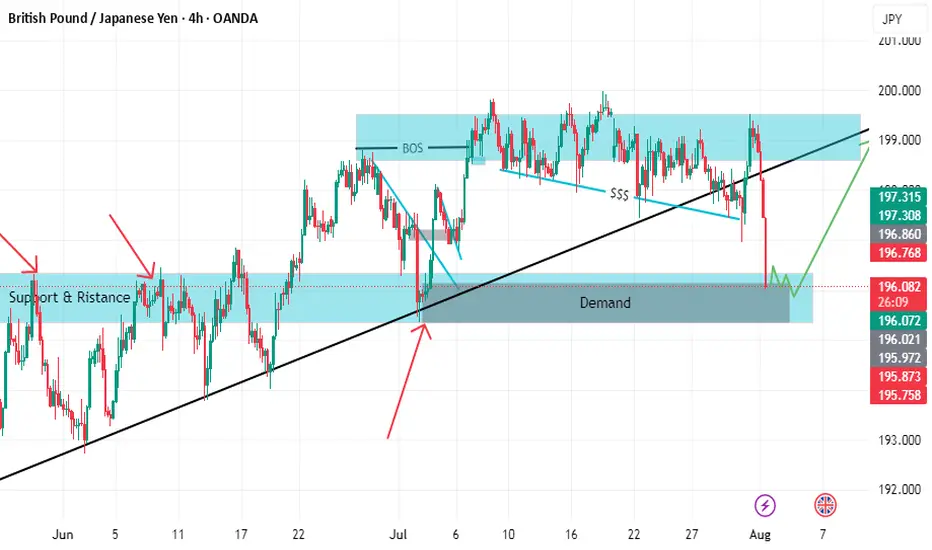
GBPJPY BUY SETUP LOOOOOOOOOOOOONGWELCOME TO YOU
we have support which is strong with retest
and we have demand and before it imbalance if you focus on photo
and the price make bos and take liquidity so i will buy with you .but prefer to be there conformation for buying
GME 1W: when the memes fade, the structure speaksGameStop is once again testing the lower boundary of its long-term consolidation, bouncing off the 21.53 zone - a level that aligns with the 0.79 Fib retracement and historical support. This zone also intersects with a key trendline on the weekly chart, and just recently, a golden cross (MA50 crossing MA200 weekly) printed - a rare but technically significant signal. The stock continues to trade inside a broad descending channel, and if this support holds, the natural next step is a move back toward the mid-range at 37.42 (0.5 Fib), followed by a possible push toward 64.92. The tactical setup favors a confirmation entry near current levels, with a stop under 21.00. Risk/reward here is among the cleanest GME has offered in months.
On the fundamental side, GameStop remains in a transitional phase. The company is shutting down unprofitable segments, reducing costs, and doubling down on e-commerce and digital distribution. Financial results are still slow to recover, but the latest Q2 2025 report showed positive operating cash flow and narrowing losses. This isn't a value play in the traditional sense - it's more about the potential for renewed retail-driven momentum if technical conditions align.
If there’s still power behind the crowd - this might be one of the most technically compelling entry zones of 2025.

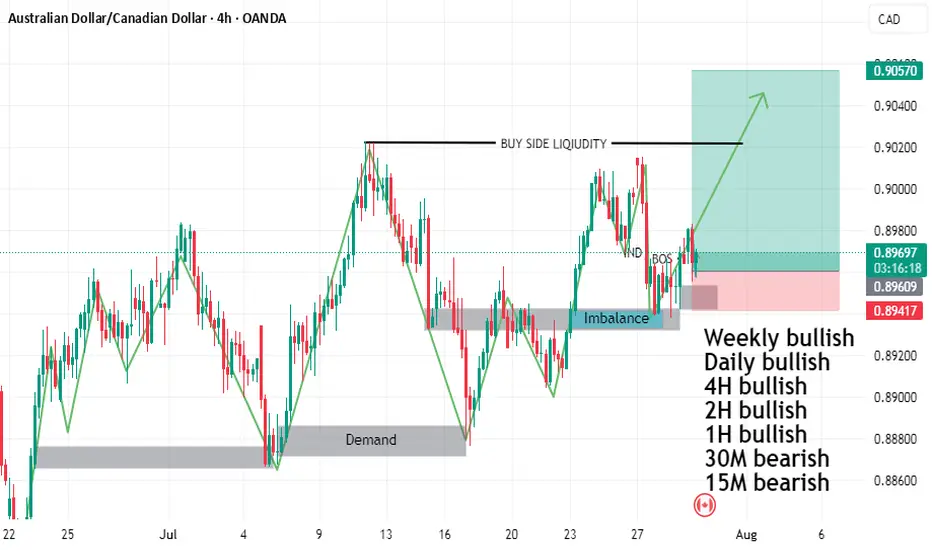
AUDCAD BUY SETUPTHE PRICE FORMED HEAD AND SHOULDER
and do rejection from mitigation order block and imbalance
and we have liquidity on time frame daily buy side liquidity
and time frame weekly double top
so I will buy with you
DON'T forget to follow me so that get more refresh analysis
OSCR: back to support and now it’s decision timeAfter the recent impulse move, OSCR has pulled back to a key support zone around 13.65. That area aligns with the 0.79 Fib retracement, a horizontal level from spring, and a rising trendline that has already triggered reversals in the past. The structure is still intact, and buyers are testing the level again. If support holds and we get a bullish confirmation, the next target is 17.01, followed by a potential breakout toward the high at 22.81.
Volume remains elevated, the overall structure is healthy, and the correction is controlled. A break below 13.00 would invalidate the setup - until then, it’s a clean, high-reward zone with tight risk.
Fundamentally, Oscar Health has revised its 2025 guidance: revenue is expected in the $12–12.2B range, with operating losses projected between $200M and $300M. Despite softening topline growth, earnings per share are improving, and investor sentiment has been shifting. Technical strength is also reflected in the recent rise in RS Rating to 93, confirming that the stock is showing relative leadership even as the market cools.
This is one of those setups where both technicals and narrative are aligning - now we just need confirmation from the chart.

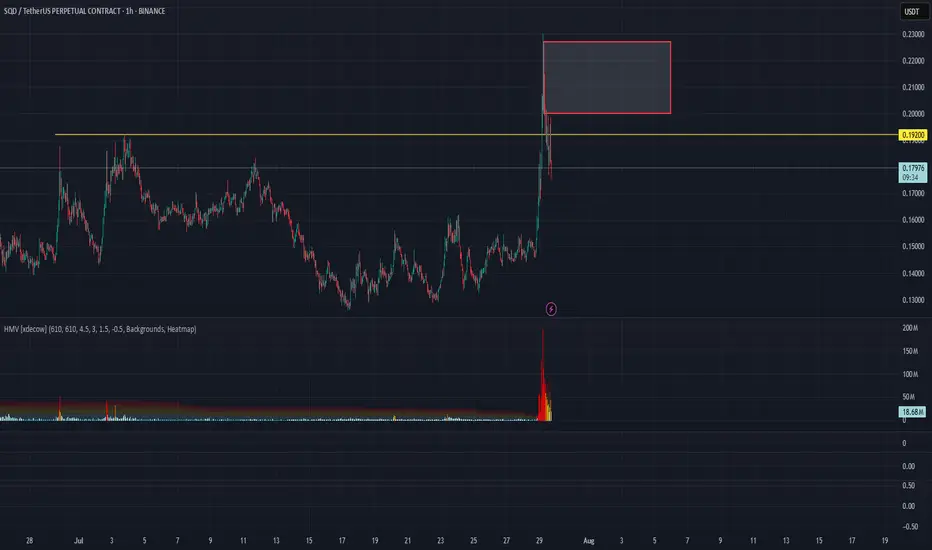
SQD/USDT Analysis — False Breakout
This token attempted to break out of a global sideways range, but failed to hold above the key level. A large amount of position closing was observed at that moment.
We are considering a short from the $0.205–$0.227 zone, provided it is retested with a clear reaction.
This publication is not financial advice.
GBPUSD BUY TIGER SETUP LOOOOOOOOOOOONGwelcome
we have strong mitigation order block on time frame weekly and daily
and on 4H we have break downtrend and retest on it
and we in well discount area
and we have demand on high time frame
so this is good idea for buying
Don't forget to follow me
so that get refresh analysis

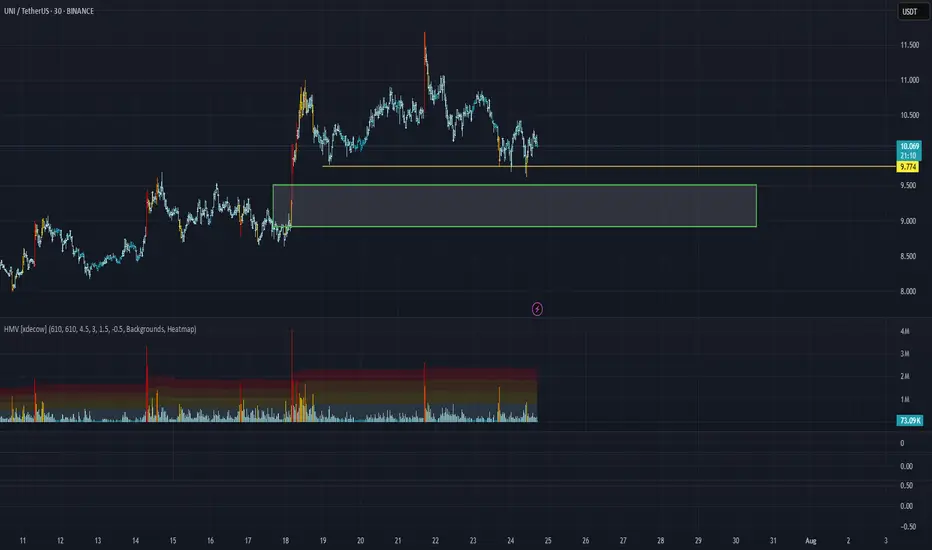
UNI/USDT Analysis. Strong Support
This pair has been in a downtrend since July 21st, but after approaching the important $9.8 level, the price has failed to break below it on three separate attempts.
Below that, there is a very strong buyer zone between $9.5 and $8.9. If this zone is tested and we see a reaction from buyers, we will consider a long position.
This publication is not financial advice.
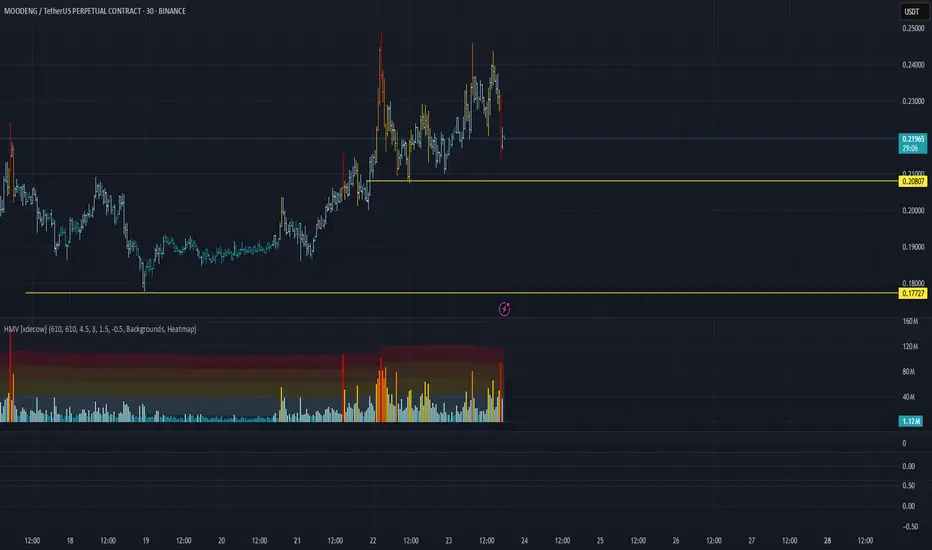
MOODENG/USDT Analysis: Looking for Long Opportunities
At the moment, we’ve been in an accumulation phase since yesterday. Within the current range, we’ve observed strong absorption of market selling based on cumulative delta (delta is falling while price remains stable). Additionally, earlier activity from a large player was noted near the lower boundary.
The safest long entry appears to be a false breakout below the $0.208 level.
This publication is not financial advice.
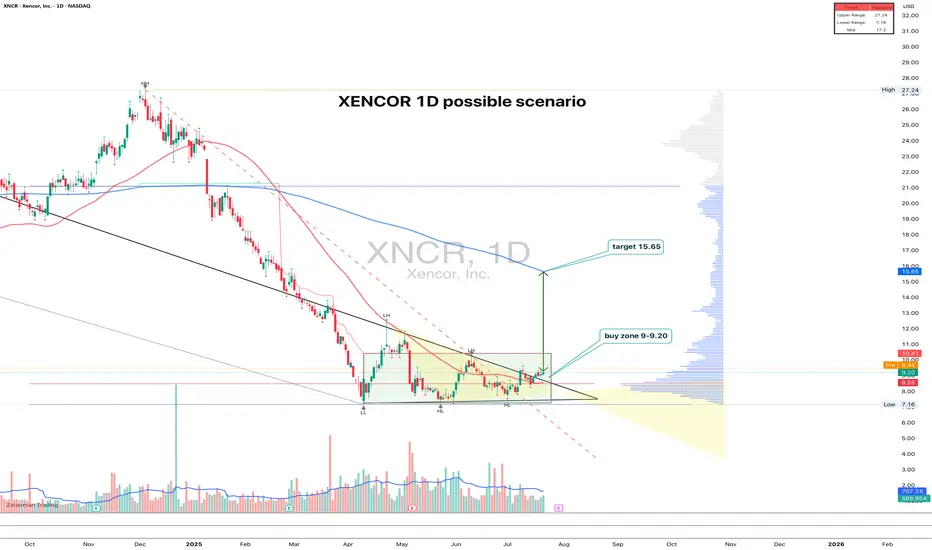
XNCR 1D time to growth?XNCR: the uptrend hasn't started yet - but someone's quietly accumulating
XNCR spent nearly 4 months building a base and finally broke out of consolidation with a clear upward move. The pattern looks like a range with a narrowing triangle at the bottom — the breakout came with rising volume. Entry makes sense in the 9.00–9.20 zone on a retest. Volume profile and Fib levels confirm the importance of this area, plus there’s a clean support shelf at 9.00. The target is 15.65, which aligns with the height of the structure. The 200-day MA is still above price, but a push beyond 11.00 could open the door to acceleration.
Fundamentally, Xencor is a biotech company focused on monoclonal antibodies. After a tough 2023–2024 and cost reductions, the market is beginning to price in signs of recovery. Key partnerships remain intact, the pipeline is alive, and recent data for XmAb7195 was well received at industry events. Valuation remains low, and biotech ETF flows are slowly picking up.
Still a relatively low-volume name, but the structure is clean, the setup is readable, and fundamentals are turning. With a tight stop below 8.50, the risk-reward looks solid.
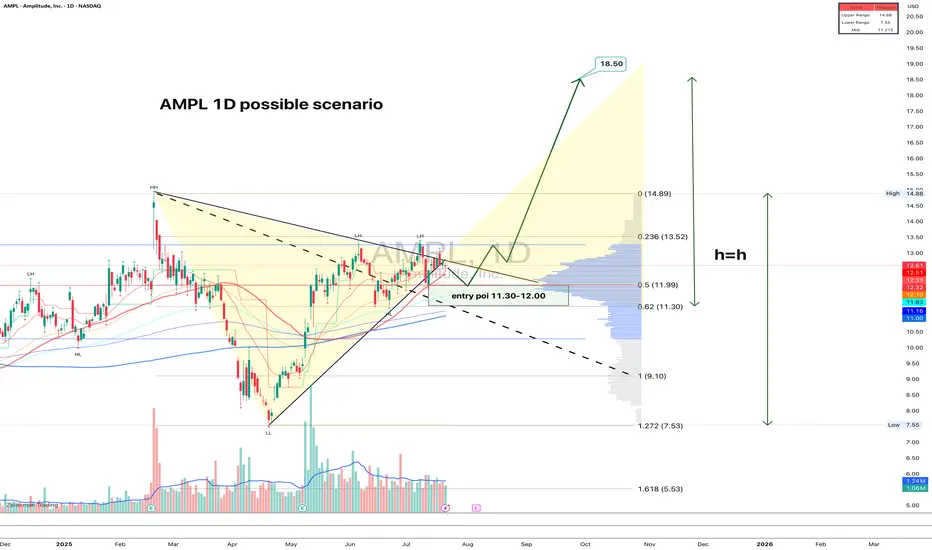
AMPL: structure clean, volume right, fundamentals warming upAMPL just broke out of a symmetrical triangle on the daily chart. The breakout was confirmed with decent volume, and now price is calmly pulling back into the 11.30–12.00 zone — exactly the kind of textbook retest that gets serious traders interested. The 0.618 Fib level sits at 11.30, and 0.5 at 11.99, strengthening this entry area. Volume has tapered off post-breakout, which is typical before a continuation. Moving averages are stacked bullish, confirming the trend shift. First upside target is 13.52, followed by 14.89, and if the full h = h move plays out, price could reach 18.50. A natural stop sits just below 11.00. Clear structure, solid risk control — this is one of those setups that checks all the boxes.
On the fundamental side, Amplitude remains a key player in product analytics and digital optimization. After a slow 2024 marked by cost-cutting and stagnating revenue, the company is showing early signs of recovery this year. The broader SaaS market has stabilized, and AMPL is benefiting from renewed enterprise demand, especially for AI-driven user behavior analytics. Recent earnings came in better than expected, and institutional interest has quietly returned. Valuation is still moderate at these levels, giving it room to re-rate if momentum builds.
A clean breakout with technical alignment and an improving macro picture - when both sides of the story match, it's worth paying attention.
GRAB 1W: Two Years of Silence — One Loud BreakoutGRAB 1W: When stocks go quiet for two years just to slap bears across both cheeks
The weekly chart of GRAB shows a textbook long-term accumulation. After spending nearly two years in a range between $2.88 and $4.64, the price is finally compressing into a symmetrical triangle. We’ve already seen a breakout of the descending trendline, a bullish retest, and the golden cross between MA50 and MA200. Volume is rising, and the visible profile shows clear demand with little resistance overhead.
The $4.31–$4.64 zone is key. Holding this level opens the path to $5.73 (1.0 Fibo), $6.51 (1.272), and $7.50 (1.618). The structure is clean, momentum is building, and this accumulation doesn’t smell like retail — it smells institutional.
Fundamentally, GRAB is a leading Southeast Asian tech platform combining ride-hailing, delivery, fintech, and financial services. Yes, it’s still unprofitable (–$485M net loss in 2024), but revenue is growing fast, recently crossing $2.3B. Adjusted EBITDA has been improving steadily, and the company holds $5.5B in cash equivalents with minimal debt — giving it excellent liquidity and expansion flexibility.
Valued at ~$18B, GRAB operates in the world’s fastest-growing digital market, with increasing institutional exposure from players like SoftBank and BlackRock. The 2-year base hints at smart money preparing for the next big move.
Tactical plan:
— Entry: by market
— Targets: $5.73 → $6.51 → $7.50
— Stop: below $4.00 or trendline
If a stock sleeps for 2 years and forms a golden cross — it’s not snoring, it’s preparing for liftoff. The only thing left? Don’t blink when it moves.

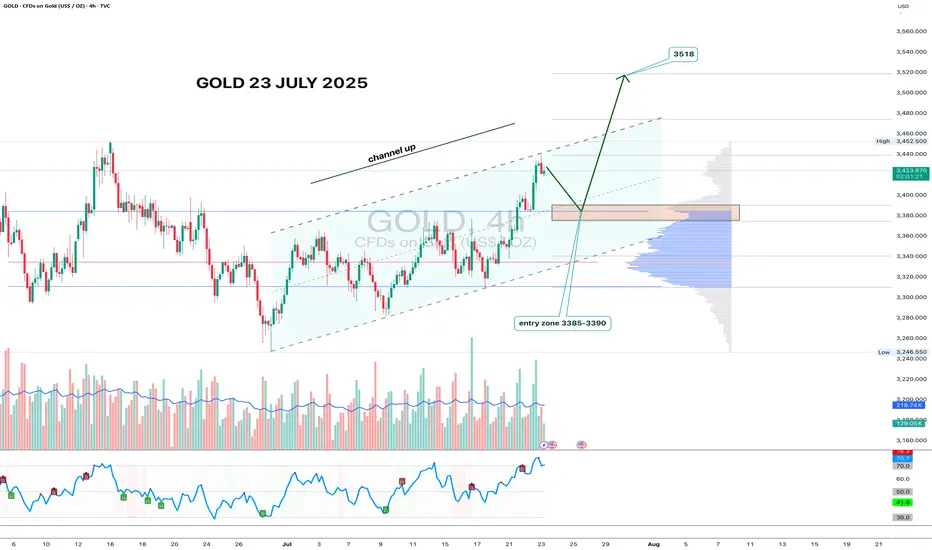
Gold 4H - channel breakout, looking for 3518 nextGold has formed a clean ascending channel on the 4H chart, broke out above resistance, and is now pulling back into the 3385–3390 zone. This area aligns with volume clusters - a perfect entry zone for bulls waiting on the sidelines.
If price holds this zone and prints a reversal candle with volume, the upside target remains at 3518 - the 1.618 Fibonacci extension and historical resistance. Volume increased during the breakout move, confirming interest. RSI still has room to go higher, supporting the bullish continuation.
Fundamentally, gold remains a safe-haven asset amid geopolitical tension, USD weakness, and potential Fed easing. Central bank accumulation further supports the bullish case.
Tactical setup:
— Entry zone: 3385–3390
— Trigger: candle confirmation + volume
— Target: 3518
— Invalidation: break below 3360 without buyer volume
If the plan plays out — gold might shine bright while bears squint in disbelief.
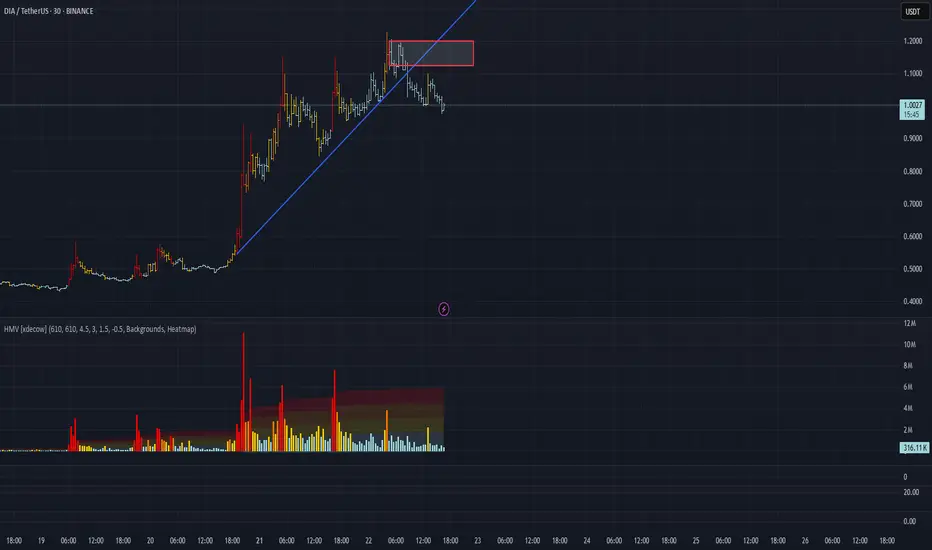
DIA/USDT Analysis: High Probability of Correction
This asset has experienced a trend break and a breakdown of the ascending trendline. A volume cluster has formed above the current price, which triggered the current correction. If these levels are retested and met with a reaction, we consider a short position with a potential target of $0.9.
Sell Zone: $1.125–$1.2
This publication is not financial advice.
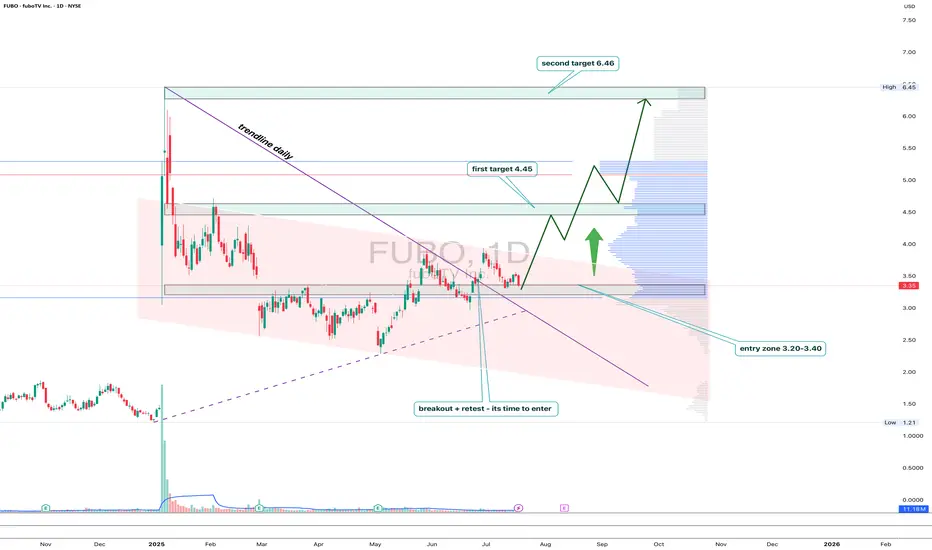
FUBO: trendline breakout with a subscription to $6.46FUBO has broken out of the descending trendline on the daily chart, followed by a clear retest and consolidation above the key 3.20–3.40 area. This zone coincides with the 0.5 Fibonacci retracement and high-volume support, confirming strong buyer interest.
As long as price holds above 3.20, the setup looks bullish with targets at 4.45 (0.382), 5.22, and finally 6.46 — the major resistance and top of the current range. Volume picked up on the breakout, validating accumulation from bigger players.
Fundamentally, FuboTV remains a niche contender in the sports streaming market. With optimized spending and new partnerships with major sports leagues, interest may spike ahead of events like the Olympics and NFL season.
Tactical setup:
— Entry zone: 3.20–3.40
— Must hold: above 3.20
— Targets: 4.45 / 5.22 / 6.46
— Invalidation: break below entry without buyer confirmation
This breakout might just be FUBO’s ticket to prime time.
Polish zloty in trouble: Swiss franc is sharpening its teethTechnically, CHFPLN has completed a consolidation phase within a narrowing triangle and broke to the upside. The pair is now testing the 4.60 level (the 0.618 Fibonacci retracement) from below — a decisive zone. A breakout and confirmation above this area opens the path toward 4.705, which coincides with the 0.5 Fibo level and a local resistance. A pullback from that zone back to 4.60 is possible, but this time as a support retest. If the level holds, the targets remain: 4.91 and 5.13 - both marked by Fibonacci extensions and major long-term horizontal resistance. The EMAs are aligned in support of further upside, with price consistently trading above them.
Fundamentally, the Swiss franc remains a safe-haven currency, especially amidst increasing instability in the Eurozone. Weak growth in Germany, looming ECB policy easing, and rising inflationary pressures are all tilting investor interest toward CHF. Meanwhile, Poland faces political uncertainty, budgetary debates, and volatility in the agricultural and energy sectors. All of this strengthens the case for the franc in this pair.
Tactically, the game plan is straightforward: a confirmed breakout above 4.60 signals the start of a bullish impulse. The 4.60–4.705 zone is the key area of interest for buyers. If this zone is reclaimed and held, the next targets - 4.91 and 5.13 - remain valid, where large players may look to take profits.
If this scenario plays out, the zloty may soon be tuning into Polish radio to sing nostalgic songs about the golden days of its strength.

BABA: triangle with tensionOn the weekly chart, BABA has already formed a golden cross - price is above both MA50 and MA200, confirming a bullish trend shift. The stock is now approaching the upper edge of the symmetrical triangle and the key resistance at $122, which also aligns with the 0.5 Fibonacci level.
The numbers inside the triangle represent the contraction phases, not Elliott waves. This is a classical consolidation before a potential breakout. If the $122 level is broken and retested, upside targets are $128 (0.618), $137 (0.786), and eventually $148–181 (1.0–1.618 extension).
Volume is rising, MACD is flipping bullish, and RSI is climbing out of oversold territory — all signs point to growing bullish momentum.
Fundamentally, Alibaba benefits from China's economic rebound, possible regulatory relief, and ongoing share buybacks. With Chinese tech rotating back into favor, BABA could lead the rally.
So if you're still waiting for a signal - it's already here. The golden cross is done, price is flying above moving averages, and all that’s left is a clean breakout. Watch $122 — that’s the launchpad.

YEXT 1W - breakout confirmed, retest inside bullish channelYext stock just pulled a clean breakout of the weekly downtrend line, retested the buy zone around the 0.5 Fibo level ($7.32), and is now bouncing within a rising channel. The 200MA and 50EMA are both below price, supporting a shift in trend even though the golden cross hasn’t formed yet. The volume increased on breakout, and there's low overhead supply - a classic setup for continuation. The arrow shows the expected move, contingent on confirmation.
Targets: 9.15 - 11.40 - 15.06
Fundamentally, Yext offers enterprise-grade AI-powered search solutions and recently gained attention with new product updates. With AI adoption accelerating, the company may ride the next wave of institutional interest.
When price retests the zone, MA is supportive, and there's no overhead resistance - that’s not noise, that’s a signal.

ES1! S&P500 Might Lose Momentum As Tariffs Deal Not Set...price could probably be testing all time highs. Before plunging....
if the volumes comes with it and reaches the all times high levels, that could be a nice short entry point for potential profits.
Otherwise, it could probably just fill the gap on week open and keep going down in a regular pattern until August as Trumps Tariffs Deals deadline is around that time possiblily...

VTI 1D: breakout on the daily within a long-term weekly uptrend On the daily chart, VTI (Vanguard Total Stock Market ETF) has broken through the key $303.5 resistance level with strong volume. This breakout occurs within a larger weekly uptrend channel, highlighting a continuation of the long-term bullish structure.
Volume profile shows a clear path ahead: $321.7 (1.272 Fibo) and $345 (1.618 Fibo). The golden cross (MA50 crossing MA200 from below) further supports the bullish case.
Fundamentally, VTI represents the entire U.S. equity market - large to small caps - and benefits from economic resilience, declining inflation, and passive inflows. It’s a logical macro play for trend continuation.
Tactical plan:
— Entry by market or after retest $303.5
— TP1: $321.7
— TP2: $345
— Invalidation below $300
The whole market breaking out? That’s not noise — it’s the signal.
