AMZN (AMAZON BUY FOR LONG TERM)NASDAQ:AMZN
HI , TRADER'S ..As per Price Action Analysis in one day TF
Price is near to make double bottom , Entry of buy after confirmation of double bottom
Target for buy will be upper resistance
❤️ Please, support my work with follow ,share and like, thank you! ❤️
IDEA

P2P | SPX - Mark upHey there trading family, just wanted to drop a few transparent pieces relating to any recent posts about #DXY.
As I mentioned, I am overall bullish on the #dollarindex due to numerous reasons I explained in the videos. This mark up on SPX was on of the chart ideas I had from this previous week and my long term analysis was correct!
So going over this trade, I'm simply using opposing forces combined with some #smt #ict knowledge of time and price (for the most part) and forming an idea around what SPX could proceed with next week.
Now for the record I don't normally trade SPX so this was a step out of my comfort zone. I wanted to post it to show that, becoming a great you must accept loses, so in my mind I'm already thinking "this could go horribly right or beautifully wrong" lol but either way I'm okay with the risk so I would be okay with the trade.
In conclusion I believe we will see SPX continue to fall but only in correlation to the dollar index. This mark up is more set on a long term Q by Q play so I will update the trade periodically!
& No more disclaimers, I expect everyone who follows the channel to be wise enough and financially competent to trade at their own risk.
Love yall, trade well, and make it your mission to put the work in all 2023!

EU Looking to move to the upsideAfter News on 2/24/23 and After Top-Down analysis i'm looking for EU to move to the upside on 2/27/23
This is not trading advice or a signal!
The Website should not be relied upon as a substitute for extensive independent market research before making your actual trading decisions.

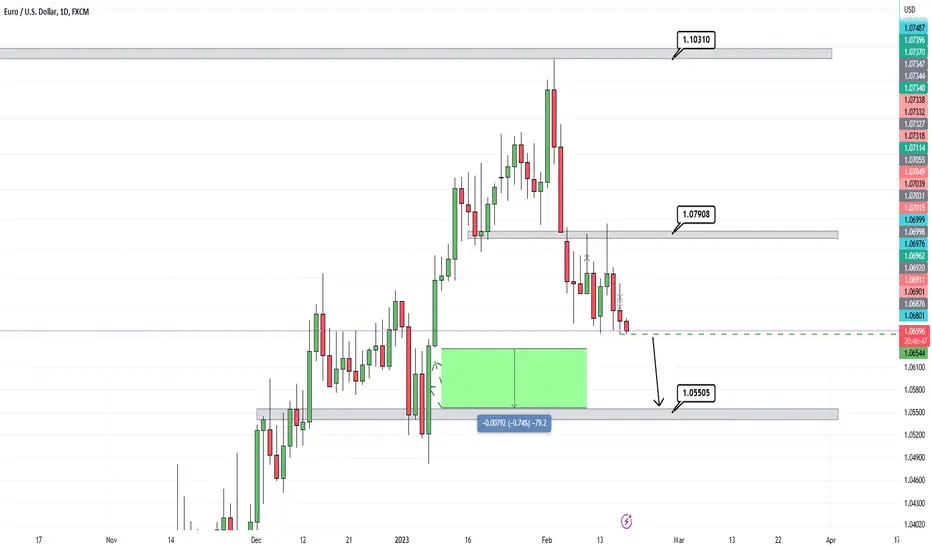
Inflation Data was a catalyst to Pullback for Liquidity/+ >PriceWell it appears that inflation helped price pullback to 1.079. Price didn't spend much time up there , less than an hour on tuesday , when data came out. ever since we have bears from last week reappear. momentum is strong because of unexpected nfp data, cpi was expected, positively declined , if that makes sense. price is showing us relentless selling pressure. i mean the price is currently holding up a weekly candle top wick that measures 123 pips which isn't unusual but significant. Price has only gone 24 pips below weekly candle open. It is likely we see a larger range created to the downside. current price 1.06596
NZDCHF | COULD BE A GOO SELL NOWHey Traders!
NZDCHF seems pretty bearish at the moment, overall direction is down, and likely going to re-test the previous bottom level that's about 30 pips, but if the pair manage to break the daily support, we will see this pair plummet further.

EURUSD | ENTRY NOW TO RISKY WAIT FOR PULLBACKHey Traders!
Recently EURUSD has been very bearish and we bank a significant amount of pips already, however, we are approaching a daily support zone, it also is likely to bounce of the 4h channel, I expect some bullish pressure there to push the market back up towards our moving averages. If and once that happens we can look for a selling opportunity with any bearish price action candlestick formation to confirm the trade.
Overall very bearish, just need a push exhaustion cycle before we can continue to be on the safe side and take this trade further.

GBPUSD | Quite strong support, market could have a pullback? Hello Traders!
Enter this only if the pair pulls back to the moving averages and gives you a bearish engulfing candlestick/shooting star confirmation to enter.
Otherwise, if support is broken ignore this trading idea, because it becomes invalid.

USDCAD | Looks like a pretty good BUYHello Traders!
USDCAD has recently broken a important daily trend and now gave us a bullish engulfing candlestick on the 4h timeframe.
The main risk is the pair has been very bullish recently so exhaustion is likely, maybe taking this trade on a pullback down, and making sure your stoploss covers the 2 moving averages would be better.

GBPUSD | COULD THIS BE A SELL? Hello Traders!
A recent bearish engulfing candlestick and a strong rejection with at the moment, shows that bearish pressure is still here to stay, after shaky US news data it looks like the trend direction won't likely change, which means the pair should keep a stable trend towards the downside.

CADJPY | Buying Opportunity? Hello Traders!
CADJPY - could be a good buy opportunity, the overall bias is bullish, we do have a squeeze at the moment, but I believe the bullish momentum will take this trade further, and once it breaks the resistance this trade has huge potentiall to go much higher.
Obviously you can wait for a break of resistance and a pullback which would be a even more solid trading setup, however for those that are not that patient, can enter now and close a portion on resistance to manage risk.

EURUSD | SELLING OPPORTUNITY? Hello Traders!
US dollar data came out, position initial claims, however GDP is negative since we have a positive & negative and the overall direction of the trade is bearish, I don't see it switching direction too much, and after the news hype, I believe it will continue to drop down to re-test previous low.

MICROHARD?Price recently broke a 2-month trendline today as well as forming a double top at the $275 zone. As of now, I'm looking for a retest of the 261.50 zone and a strong indicator signifying a continuation of this downward movement.

Idea - JXN, Feb 8 (short)Current trend has been stagnating for a few days; after a solid uptrend we're entering consolidation.
CLAMP indicator looks like it will turn blue in the very next session. This is technically a reversal, which my system does not trade. If entered today, the short would have a TP at $45.39, and could trend as low as 35.11 to 39.81.

Idea - EWW, Feb 13 (short)As detailed on the chart, the trend has continued for some time, however price action may go back to the downside and move in our favor. If you entered on Feb 6th with the original cross signal, you'd still be waiting for the trade to do its thing; waiting to enter now basically gave us a pullback in our favor.
Not sure I'd enter a position short here, but the setup looks interesting.
CPI data comes out in a few days, and EWW is strongly correlated to the broader US market .

Bullish on USD/CAD: Exploring the Upside PotentialHey Traders!
NEWS COMING UP SOON IN 15-30 Min so this could change and react accordingly.
👨💻 Technical: Trending toward the upside nicely, however, we have a downtrend, if we manage to break it and have a push exhaustion cycle this could be a good way to enter the trade for a good RR. You could also risk a short-term trade and trade the 20-30 pips space for potential bullish profit if it re-tests the trend.
🎯 For an ideal entry: Wait for a push exhaustion cycle to happen, and then see where we are, news coming up soon so the cycle could happen quicker than expected.

Market Bias & Top Stock Watches - 2/21/2023 - BearishBias: Bearish. Could bounce off open. Room to at least 400, maybe lower.
Top Watches: I will update this post with my top four long and short ideas between 9:25 - 9:30 EST.
Tune in to my stream at 9:45 EST for my full list of top stock watches and to watch me trade them Live!
Follow @JLaing for a timely morning bias of the market like this, top stock watches, and live day trading every morning!

USOIL (CRUDE OIL) PERFECT BEARISH SETUPTVC:USOIL
HI , TRADER'S .. AS YOU CAN SEE HEAD & SHOULDER PATTERN IN 4HR TF
Price is making beautiful bearish H & S , Price is completing right shoulder and reaching Neckline
Neckline or support line is near 72.90 , once market breakout from neckline and retest it
Sell entry can execute after retest , Target will be 64.00
Trade with proper risk management
❤️Please, support my work with follow ,share and like, thank you!❤️

IDEA - Shift In Momentum In Action!Hello TradingView Family / Fellow Traders. This is Richard, also known as theSignalyst.
After an over-extended bearish trendline, IDEA has been trading inside a range after rejecting the round number 0.01
We have been stuck inside the accumulation between 0.01 and 0.018
🏹 For the bulls to take over, we need a Daily Candle Close above 0.018
Meanwhile, since IDEA is inside a range, we will be looking for short-term buy setups as we approach the lower bound of the range 0.01
📚 Always follow your trading plan regarding entry, risk management, and trade management.
Good luck!
All Strategies Are Good; If Managed Properly!
~Rich


GBPUSD Daily Breakdown - Break or incoming turbulence Morning team - good day yesterday - we our hitting a 4hr OB and I suspect us to slow down this downtrend momentum soon.
GU
Daily bullish
4h bearish
15 swing bearish
15 immediate bearish

6M DXY idea. What do you think?This is an idea for the DXY on the 6M timeframe. I think we are in a big buy program. The dollar is going to go higher.
What do you think?
What do you see with your method?

EU made a retracement Tuesday. Looking for Bullish movement!After Top- Down analysis i'm looking for EU to move to the upside.
This is not trading advice or a signal!
The Website should not be relied upon as a substitute for extensive independent market research before making your actual trading decisions.

MATIC/USDT CorrectionMatic needs correction on Binance 4h chart pattern, 10 % Correction is completed how more correction requires ? Mostly coins were 20 % correction after its peak performance, Matic has completed its 10% and 10 % Remains , if you have any idea please paste your idea in comments area.
