$PNUT/USDT Breakout Trade Setup$PNUT / USDT - Breakout Trade Setup.
Entry: $0.2963 - $0.3002
Stop Loss: $0.2682
Targets: $0.3603 / $0.4305 / $0.4891
Breakout & retest of descending trendline
60 %+ upside potential
DYOR | NFA
IDUSDT

$IDUSDT 1D chart The BINANCE:IDUSDT 1D chart shows a potential breakout from its long downtrend.
Price recently bounced off a strong demand zone at $0.1785 and is now testing above the descending trendline.
If momentum holds, a move toward the $0.4004 target +131% is possible.
Watch for strong volume confirmation to validate the breakout.
DYRO, NFA

IDUSDT Analysis ID ~ 4D Analysis
#ID Buy on retesting this buy zone or buy on successful breakout of the resistance line of this pattern. With a short term target of at least 10%+.

SCRTUSDT UPDATE
SCRT Technical Setup
Pattern: Falling Wedge Breakout
Current Price: $0.2453
Target Price: $0.59
Target % Gain: 160.55%
Technical Analysis: SCRT has broken out of a falling wedge on the 1D chart, indicating a bullish reversal. The breakout is confirmed with strong green candles and volume build-up.
Time Frame: 1D
Risk Management Tip: Always use proper risk management.

ID is bearish for the mid-term (2D)Before anything, pay attention to the timeframe—it's a 2-day timeframe, so it will take time.
Given that a large-degree bearish triangle has completed, this coin may remain bearish in the mid-term. The red zone is where the next major bearish wave could start.
A daily candle closing above the invalidation level will invalidate this analysis.
For risk management, please don't forget stop loss and capital management
Comment if you have any questions
Thank You

DEGOUSDT UPDATEDEGO/USDT Technical Setup
Pattern: Falling Wedge Breakout
Current Price: $1.808
Target Price: $3.70
Target % Gain: 115.05%
Technical Analysis: DEGO broke out of a falling wedge on the 1D chart, showing bullish momentum with a clean candle close above resistance and follow-through volume. Chart suggests potential continuation toward the measured target.
Time Frame: 1D
Risk Management Tip: Always use proper risk management.

STRAXUSDT UPDATESTRAXUSDT is a cryptocurrency trading at $0.04440, with a target price of $0.07000. This represents a potential gain of over 80%. The technical pattern observed is a Bullish Falling Wedge, indicating a possible trend reversal. This pattern suggests that the downward trend may be coming to an end. A breakout from the wedge could lead to a significant upward movement in price. The Bullish Falling Wedge is a positive indicator, signaling a potential price surge. Investors are showing optimism about STRAXUSDT's future performance. The current price may present a buying opportunity. Reaching the target price would result in substantial returns for investors. STRAXUSDT is positioned for a potential breakout and significant gains.

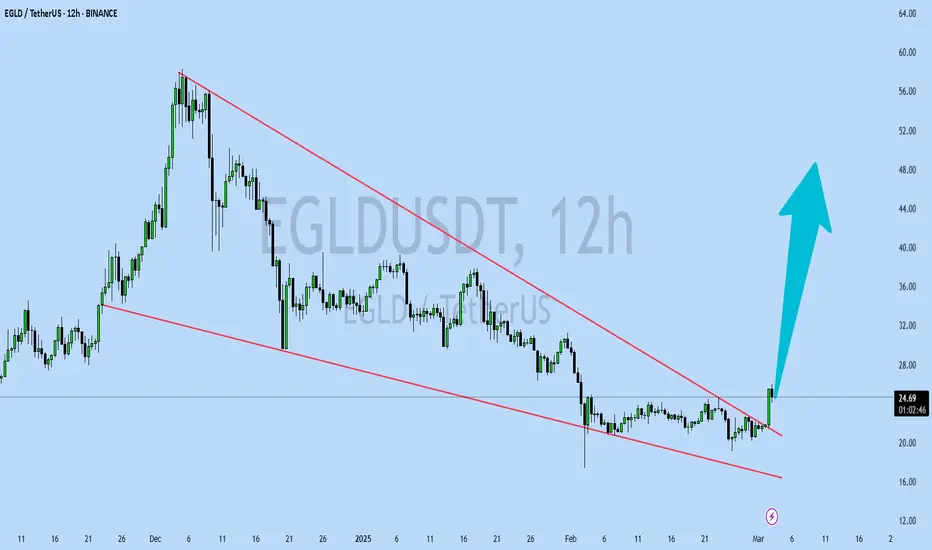
EGLDUSDT UPDATEEGLDUSDT is a cryptocurrency trading at $24.65. Its target price is $48.00, indicating a potential 90%+ gain. The pattern is a Bullish Falling Wedge, a reversal pattern signaling a trend change. This pattern suggests the downward trend may be ending. A breakout from the wedge could lead to a strong upward move. The Bullish Falling Wedge is a positive signal, indicating a potential price surge. Investors are optimistic about EGLDUSDT's future performance. The current price may be a buying opportunity. Reaching the target price would result in significant returns. EGLDUSDT is poised for a potential breakout and substantial gains.
#ID/USDT#ID
The price is moving in a descending channel on the 1-hour frame and is expected to continue upwards
We have a trend to stabilize above the moving average 100 again
We have a descending trend on the RSI indicator that supports the rise by breaking it upwards
We have a support area at the lower limit of the channel at a price of 0.2516
Entry price 0.2720
First target 0.2810
Second target 0.2895
Third target 0.3068

IDUSDT 5DID ~ 5D Analysis
#ID Buy gradually from here with a minimum target of 20%+
The reason, this is the lowest support for now.

CELRUSDT UPDATECELRUSDT is a cryptocurrency trading at $0.01372. Its target price is $0.02000, indicating a potential 60%+ gain. The pattern is a Bullish Falling Wedge, a reversal pattern signaling a trend change. This pattern suggests the downward trend may be ending. A breakout from the wedge could lead to a strong upward move. The Bullish Falling Wedge is a positive signal, indicating a potential price surge. Investors are optimistic about CELRUSDT's future performance. The current price may be a buying opportunity. Reaching the target price would result in significant returns. CELRUSDT is poised for a potential breakout and substantial gains.

#ID/USDT#ID
The price is moving in a descending channel on the 1-hour frame and is adhering to it well and is heading to break it upwards strongly and retest it
We have a bounce from the lower limit of the descending channel, this support is at a price of 0.3000
We have a downtrend on the RSI indicator that is about to break and retest, which supports the rise
We have a trend to stabilize above the moving average 100
Entry price 0.3322
First target 0.3156
Second target 0.3237
Third target 0.3322

ELFUSDT UPDATEELFUSDT is a cryptocurrency trading at $0.3090. Its target price is $0.5000, indicating a potential 60%+ gain. The pattern is a Bullish Falling Wedge, a reversal pattern signaling a trend change. This pattern suggests the downward trend may be ending. A breakout from the wedge could lead to a strong upward move. The Bullish Falling Wedge is a positive signal, indicating a potential price surge. Investors are optimistic about ELFUSDT's future performance. The current price may be a buying opportunity. Reaching the target price would result in significant returns. ELFUSDT is poised for a potential breakout and substantial gains.

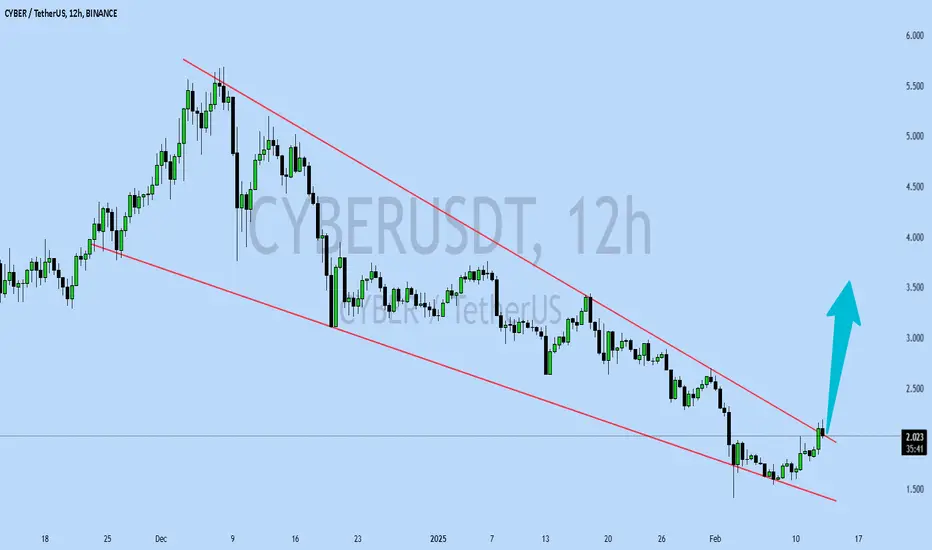
CYBERUSDT UPDATECYBERUSDT is a cryptocurrency trading at $2.026. Its target price is $3.500, indicating a potential 70%+ gain. The pattern is a Bullish Falling Wedge, a reversal pattern signaling a trend change. This pattern suggests the downward trend may be ending. A breakout from the wedge could lead to a strong upward move. The Bullish Falling Wedge is a positive signal, indicating a potential price surge. Investors are optimistic about CYBERUSDT's future performance. The current price may be a buying opportunity. Reaching the target price would result in significant returns. CYBERUSDT is poised for a potential breakout and substantial gains.
CAKEUSDT UPDATECAKEUSDT is a cryptocurrency trading at $21.85. Its target price is $3.500 is likely incorrect, as it would be a significant price drop. However, assuming the target price is actually higher, a more plausible target would be around $39.41, indicating a potential 80%+ gain. The pattern is a Bullish Falling Wedge, a reversal pattern signaling a trend change. This pattern suggests the downward trend may be ending. A breakout from the wedge could lead to a strong upward move. The Bullish Falling Wedge is a positive signal, indicating a potential price surge. Investors are optimistic about CAKEUSDT's future performance. The current price may be a buying opportunity. Reaching the target price would result in significant returns.

IDUSDT 3DID ~ 3D Analysis
#ID In the 3D time frame, this is a very good support for now, Buy from here if you still have a Conviction on this coin with a minimum target of 20%+

PYRUSDT UPDATEPYRUSDT is a cryptocurrency trading at $2.929. Its target price is $4.200, indicating a potential 45%+ gain. The pattern is a Bullish Falling Wedge, a reversal pattern signaling a trend change. This pattern suggests the downward trend may be ending. A breakout from the wedge could lead to a strong upward move. The Bullish Falling Wedge is a positive signal, indicating a potential price surge. Investors are optimistic about PYRUSDT's future performance. The current price may be a buying opportunity. Reaching the target price would result in significant returns. PYRUSDT is poised for a potential breakout and substantial gains.

VTHOUSDT UPDATEVTHOUSDT is a cryptocurrency trading at $0.002696. Its target price is $0.003800, indicating a potential 45%+ gain. The pattern is a Bullish Falling Wedge, a reversal pattern signaling a trend change. This pattern suggests the downward trend may be ending. A breakout from the wedge could lead to a strong upward move. The Bullish Falling Wedge is a positive signal, indicating a potential price surge. Investors are optimistic about VTHOUSDT's future performance. The current price may be a buying opportunity. Reaching the target price would result in significant returns. VTHOUSDT is poised for a potential breakout and substantial gains.

HBARUSDT UPDATEALGOUSDT is a cryptocurrency with a current price of $0.3900. Its target price is $0.5500, indicating a potential 50%+ gain. The pattern is a Bullish Pennant, a continuation pattern signaling a potential breakout. This pattern suggests a brief consolidation before a strong upward move. The Bullish Pennant is a positive signal, indicating a potential price surge. Investors are optimistic about ALGOUSDT's future performance. The current price may be a buying opportunity. Reaching the target price would result in significant returns. The Bullish Pennant pattern typically leads to a strong upward move. ALGOUSDT is poised for a potential breakout.

LQTYUSDT UPDATELQTYUSDT is a cryptocurrency trading at $1.830. Its target price is $3.000, indicating a potential 60%+ gain. The pattern is a Bullish Falling Wedge, a reversal pattern signaling a potential trend change. This pattern suggests that the downward trend may be ending. A breakout from the wedge could lead to a strong upward move. The Bullish Falling Wedge is a positive signal, indicating a potential price surge. Investors are optimistic about LQTYUSDT's future performance. The current price may be a buying opportunity. Reaching the target price would result in significant returns. This pattern typically leads to a strong upward move.

PHAUSDT UPDATEPHAUSDT is a cryptocurrency trading at $0.3209. Its target price is $0.5000, indicating a potential 50%+ gain. The pattern is a Bullish Falling Wedge, a reversal pattern signaling a potential trend change. This pattern suggests that the downward trend may be ending. A breakout from the wedge could lead to a strong upward move. The Bullish Falling Wedge is a positive signal, indicating a potential price surge. Investors are optimistic about PHAUSDT's future performance. The current price may be a buying opportunity. Reaching the target price would result in significant returns. This pattern typically leads to a strong upward move.

HBARUSDT UPDATEHBARUSDT is a cryptocurrency trading at $0.32332. Its target price is $0.46000, indicating a potential 50%+ gain. The pattern is a Bullish Pennant, signaling a brief consolidation before a breakout. This pattern suggests a continuation of the upward trend. Investors are optimistic about HBARUSDT's future performance. The Bullish Pennant is a positive signal, indicating a potential price surge. The current price may be a buying opportunity. Reaching the target price would result in significant returns. Overall, HBARUSDT's Bullish Pennant pattern makes it an attractive investment option. This pattern typically leads to a strong upward move.

Can #ID Bulls Really Continue this Bullish Momentum? Key LevelsYello, Paradisers! Will #IDUSDT rally to new highs or face a sharp rejection? Let’s dive into the current setup of #SpaceID:
💎#ID recently broke out of a well-defined descending channel—a structure often signaling a shift in trend. Currently, the price is consolidating near the $0.423 support zone, a critical level to watch for the next move. For bulls to regain momentum, the price must decisively break above the $0.5773 resistance zone. This will confirm the breakout and open the door for a significant rally.
💎If #IDUSD successfully reclaims the $0.577 resistance level, the next key hurdle lies in the major resistance zone around $0.750. A breakout above this level would likely trigger a strong upward move, potentially targeting even higher levels. Watch for increased trading volume and strong bullish candles above $0.577 as confirmation of market strength.
💎On the downside, if the price fails to hold above the $0.423 support zone, a retest of the demand zone near $0.366 becomes highly probable. This area has historically attracted buyers, but if it fails to hold, the bullish setup will be invalidated.
💎A daily close below $0.366 could lead to further downside pressure, with potential targets near $0.3000 or lower. So, let's see how this #ID setup turns out, but the probability of it going up is higher.
Stay focused, patient, and disciplined, Paradisers🥂
MyCryptoParadise
iFeel the success🌴
