PANR IDX Daily Chart Potensial for Upside, retest the resistence at 282
Target and Resistence as shown (red)
Support as shown (green)
Disclaimer on
IDX


IDX : BBRI WEEKLY IN SHORT CORRECTION TO 3860-3940BBRI Weekly Chart most likely will be going down to the 3860-3940 where the support harmonic and dynamic met cluster (fibonacci 0,5-0,618 and support dynamic EMA 90).
After the price hit the support, hopefully the Trend Movement (BULLISH TREND) will comeback to the Resistance Area at 4770-4810.
Stochastic momentum indicator show us that the trend still going down to Oversold Area thats mean there is a chances BBRI will stop the bullish rally for a moment.
And for your info, BBRI has a gap at 4600. Gap in Big Banks have a very big chance to close either gap up or gap down.
Buy BBRI little by little at the price 3800-4000 and Hold it until the price make a comeback at 4800.
Stop Loss under 3800
Take Profit 4800
DISCLAIMER ON


Interesting to Followthis gonna be good, but wait and see first because it's breaking resistance, maybe will go to terting the resist i dont know


Where Will They Go??dont know what to do, just wait and see, i hope this gonna be down for a bit then soaring more

Very Long Green Candlestickit might good for day trading, breaking resistance, or let's see it might as well good for swing swing
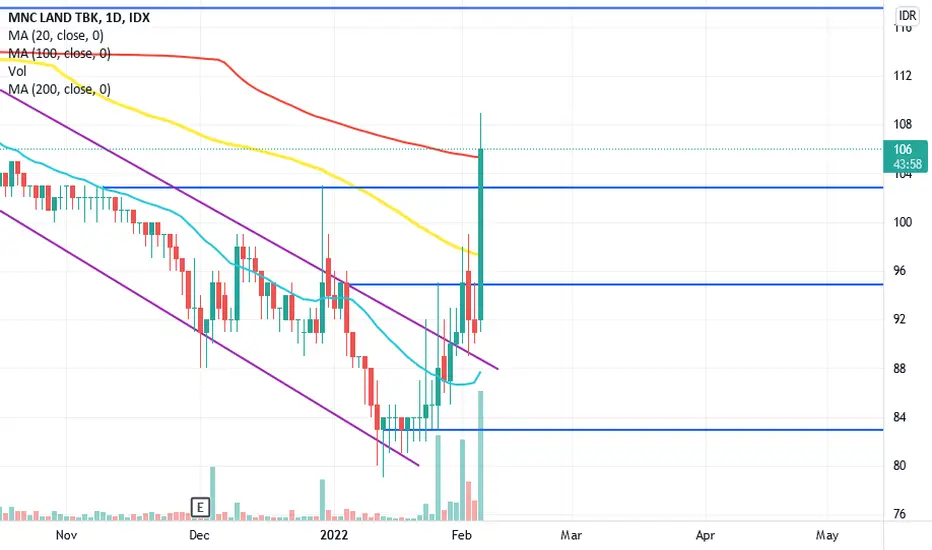
Breaking Resistance is it a reversal sign? let we see later, long green candlesitck in a day would be good for day trading

Would be Great If it ReboundsWhat do you think? the market nowadays rebound, let see if this ticker do the same

ESTI has potential up 40%ESTI is on good support level and could be bouncing up soon for 30-40% gain. Analysis is based on daily and monthly analysis.

IDX : BBRI DISCLAIMER ON
This analysis is not financial advice. Please note that you are responsible for your own investments. This chart only represents my opinion and view about cryptocurrency market in general and may be used only for educational purposes.

Q1 2022 IDX Targets 6902 - 7020Bullish run projection in Q1 2022 for IDX after a failed window dressing in December 2021.
DISCLAIMER ON
This analysis is not financial advice. Please note that you are responsible for your own investments. This chart only represents my opinion and view about the stock market in general and may be used only for educational purposes.


Going to Uptrend?since this ticker going down, now in the begining of 2022 there's an uptrend sign, would it be there for real?

Breaking Resistanceit's gonna be great, if market makers put a lot of money here, just follow them, maybe it's a good start for 2022, id ont know
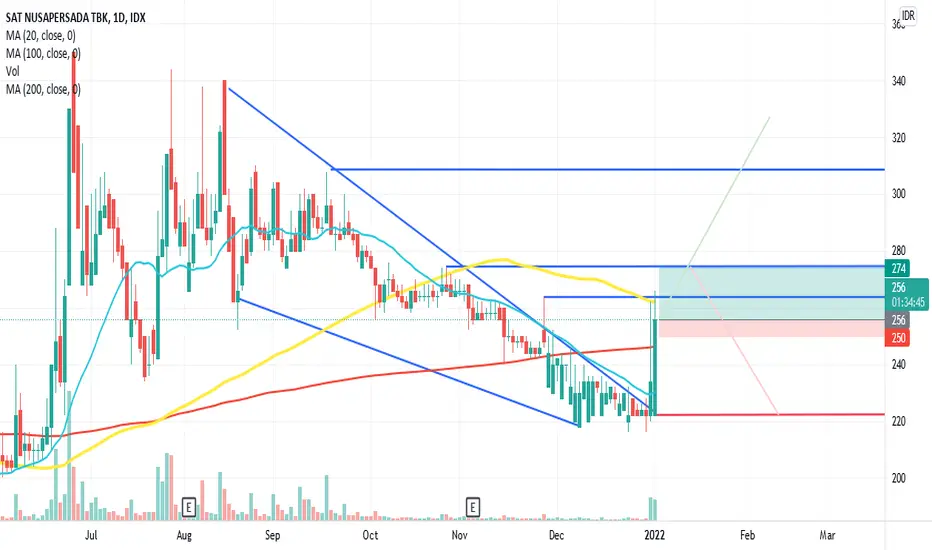
Breaking Resistancewill be good or not i dont know, just wanna put here, who knows become something good then

Breaking resistancelooks like thay stop going down, and start to uptrend, maybe it's a good sign, i dont know, wdyt?

Where will they go?is it strong enough to be uptrend? support and ressitance are clear enough, but i dont know, just another opportunity here

Trading PlanTrading plan is so importan, give us perspertive and timing when to buy, sell, cut loss, take profit and something like that, wdyt?

INDYIDX:INDY
Will try to initiate buy for INDY around FIBO Channel 0.5 and will use Intraday chart for signal.
Swing High and Low Daily around 1900. Will be my target.
Stop Loss below lower FIBO channel.
