IHSG COMPOSITE IHSG setelah rally, harusnya minggu depan koreksi sehat dulu ya.
but the trend is very strong bullish, jangan khawatir.
jika mau entry tunggu koreksi sehat, dengan metode mencicil, karena secara historikal, november selalu merah.
Ihsg


[Weekly] IHSG Bullish pennantKalau kita lihat chart IHSG pada timeframe weekly ternyata sedang mengalami koreksi dan membentuk Bullish Pennant. Secara teknikal tentu saja kondisi ini pertanda baik karena IHSG turun untuk naik lebih tinggi. Target kenaikan IHSG adalah 7549.

JKSEWait and see, therese possibility to fill down the gap first so it can move/rally bullish trend again

IDX COMPOSITE : A retrace before another rally seasonCurrently IHSG is facing a correction phase after a massive rally since the novel COVID-19 market shocks. Based on fibonacci retracement, the B wave target correction is around 5917 - 6029. After the B wave correction, we might be facing another sideways market with ABCDE corrective pattern. If IHSG breaks the minor trend line (red dashed line), we can start preparing for the 5th wave of this market cycle with target area around 6980 - 7023. Please note the 5th impulsive wave assumption might be invalid if the current corrective phase breakthrough the 1st wave area.
Hope you are all healthy,
RK
DISCLAIMER ON
These analyses are not an investment recommendation or a financial advice. Please note that you are responsible for your own investments when trading on the stock exchange. This chart only represent my opinion and view about IDX market in general and maybe used only for educational purposes.

Jakarta Composite Index (IHSG)- Shall the Downtrend Continues?Hi,
Jakarta Composite Index (IHSG) has been on the downtrend for the last one month. If we look at the chart, we can find a double top which the support has been breached and become a resistance.
The Index has just tested the resistance and pull back which can signal a possible downtrend. The key points for a further down will be :
1. Covid 19 Vaccination has started in Indonesia. However, there are areas in the country refusing to receive the doses;
2. Indonesian companies are subjected to release their 2020 full year audited financial report which is assumed not to be in a good performance;
3. Bank Indonesia is going to announce the interest rate.
Remember, The trendline might be breached. As long as it is not, I am going to stay liquid.
Happy Investing!

MBSS : SAIL TO THE MOONMBSS : Energy Shipping Company
The chart is bullish
Supporting data:
1. Price making a bullish trend, Higher Low one after another
2. Confirmed Cup and Handle (a perfect 61.8% Fibo) which already broke previous supply zone and retraced
3. The retracement happen with a bounce inside the green box (which describes a demand zone on weekly timeframe)
4. What will happen now is some consolidation before upward movement
As the phase of energy sector (especially coal) prevailed 2 months before, so will the sector of its shipping
Sail it to the moon, ppl

HMSP, IDX UPDATEThe retracement of IDX gives us second opportunity to grab HMSP.
Shown here is a 4 hour timeframe analysis
Several data to support this analysis (based on multiple timeframe)
1. The downside to the level of 1270 close the previous gap seen in 1 Hour TF and now closed.
2. Market structure breaking previous supply zone seen in 4 hr tf and 1d TF happened in May 2020 and now requires a retracement
3. Detecting the level of retracement, I drew fibonacci and found the fibo 0.786 match with 1270.
Having tapped 1270, we could see a major buying power into the stock.
Conclusion
- Set a buy order at the level 1350 as this represents a healthy pullback to a formed breaker
- slowly buying, to wait for the movement that is upside
PUMP IT!
Disc On

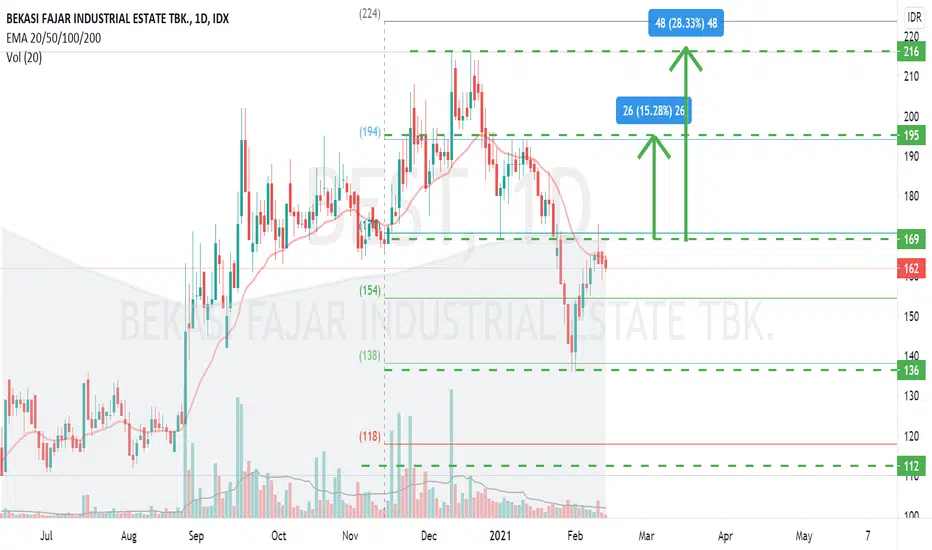
THE BEST IN ITS SECTOR, AND IT IS "BEST"Supporing Data:
- Midterm, the structure is still uptrend identified by price still making Higher Low
- 3 Days TF, SR flip has been highlighted in the greenbox
- Several Bull Engulf if zoom in in the daily timeframe (in the zoom between 138-140) concurrent with a setup of retracement
The level of 170 is where the sellers are as the price is difficult to breakthrough these area so it might take another buyer powers waiting at the level of 150 before penetrates through 170.
Long this one!

IDX or IHSG IDEA, FEBRUARY 2021After tapped daily supply at around 6500, it should retrace as this denotes healthy for IDX to have upward movement
This may be how this will play out in my opinion
Retracement to the range of 5717 - 5750 is expected before upward movement. Several data to support the confluences:
- It represents the level of 1H previous supply that has been broken and now act as "S/R flip"
- Green box denotes breaker on 4 HR timeframe
- Concurrent with EMA100 on daily timeframe + EMA200 on 4 HR Timeframe
- Also, on weekly timeframe, we could see EMA20 around that zone
Conclusion : 5717-5750 on first week of february
The next move has been plotted on the chart based on my opinion
Disc on


Buy on BreakoutBuy if > 590 ( Aggressive )
Break 590 and price retouch 590 ( Conservative )
SL < 500
Target1 750
Target2 840

Buy on BreakoutBuy if > 153 ( Aggressive )
Break 153 and price retouch 153 ( Conservative )
SL < 140
Target1 190
Target2 220


POWR ROADMAPPOSSIBLE PATTERN :
- ASCENDING SCALLOP
- CUP AND HANDLE
--------------------------------
※ DON'T FORGET TO USE TRAILING STOP 5%
※ ENTRY BUY:
- BUY ON BREAK OUT: 816 - 817
- ENTRY BUY AT RANGE PRICE OF 755 - 785
(CLOSEST RESISTANCE TO BE BREAK IS AT 815)
---------------------------------------------------------------------------
※ TARGET PROFIT 1: 865 (FIBONACCI EXTERNAL RETRACEMENT 1 - 1.618)
※ TARGET PROFIT 2: 890 (FIBONACCI EXTERNAL RETRACEMENT 1.618)
※ STOP LOSS: 730
------ DISCLAIMER ON ------

When Head and Shoulder pattern is over, time to BUYTrading plan as attached on the chart.
May the profit be with us!

Potential Area to BuyShort Term Trading
Consider to BUY if price > 169
Target1: 195
Target2: 210
Domestic : Foreign Composition = 50:50
LONG TERM
PBV BEST is still under its 5 yrs average (0.64), current = 0.36
Why Cut Loss in ASII?ASII is a retail favorite LQ45 stocks, including me. But a few days ago, I decided to sell ASII with loss.
Here is the reasons:
1) After bouncing back from support at EMA100 and breaking EMA50, it turned out that ASII was unable to break through to EMA20 and turned back to EMA100.
2) When it fails to break EMA20 at 6275 and then goes down, the chart formation is potential to form a Head and Shoulder pattern.
3) Because ASII is a share held most by foreigners with a proportion of 72% as of 31 January 2021, it is important to look at foreign flows. And it turns out that foreigners have made significant distribution actions.
There is also some speculations spread out in connection with the slump in ASII. There are those who associate it with the collapse of the Cipali toll road, there is also because of foreign broker portfolio rebalancing by exchanging ASII's ownership to BBRI and ANTM (because of MSCI).
Whatever it is, the chart shows a potential for a significant decline, if the HnS scenario occurs.
The decision to sell is a rational decision, as it seems. What you see is what you get.
So Simple!
I will wait for the correction in the area that I have marked on the chart.
@MonsterTurtle


IDX Composite - Take A Breath & Get Back to Running Track SoonHello traders & investors... how are you?
I hope all of you are healthy & prosperous.
Today, I try to capture the movement of IDX Composite for the next 6 months, 'till August 2021.
IDX Composite will tend to move sideways until June 2021 because the FY'20 earnings result might release "as expected", and Indonesia soon will entering the fasting month (mid of April'21), that may reduce daily transaction and drive IDX Composite slightly lower. Thereafter, start in Q3 2021 it will back to move in up trend in the moment of dividend seasons & Q2 2021 GDP release.
Gong Xi Fa Cai!
-AJ-


