ALDO - CUP WITH HANDLEIDX:ALDO (CUP WITH HANDLE)
28-10-2024
(+):
1. Low risk entry point, first time the stock showing it’s buying point
2. Volume dries up on handle
3. Stock showing it’s strength while market is corrected
4. Price above MA 50 > 150 > 200 over 10 weeks
5. Price is within 25% of 52 weeks high
6. Price is over 30% of 52 weeks low
7. 200 day MA trending up over 1 month
8. RS Rating is over 70 (82)
(-):
1. Not really confirmed Stage 2, there is high that need to break out at price 520
Ihsg

TLKM BULLISH PREDICTIONTLKM have reached the support area and in a consolidation area. i think the price will rebound in the future. the price have also reached the lowest price in the past 10 years

BBRI short time predict to 4000???
BBRI chart (DAILY) already show a sign for down trend for short period.
Maybe going to 4000 (key area multiple support and rejection)
after 4000 hit, hopefully BBRI will continue rising to 6000 because so many gap between 5000 to 6000.

PBID - CUP-COMPLETION CHEATIDX:PBID (3C)
14-10-2024
(+):
1. Low risk entry point
2. Volume dries up
3. Price above MA 50 > 150 > 200 over 10 weeks
4. Price is within 25% of 52 weeks high
5. Price is over 30% of 52 weeks low
6. 200 day MA trending up over 1 month
7. RS Rating is over 70 (86)
(-):
1. Not really in Stage 2-a uptrend
2. No big volume on the breakout

UNTR - CUP WITH HANDLEIDX:UNTR CUP WITH HANDLE
13-12-2024
(+):
1. Low risk entry point on nice drifting handle
2. Price above MA 50 > 150 > 200 over 10 weeks
3. Price is within 25% of 52 weeks high
4. Price is over 30% of 52 weeks low
5. 200 day MA trending up over 1 month
6. RS Rating is over 70 (79)
7. Price break major downtrend, it's mean the stock started on Stage 2 uptrend
(-):
1. The stock is slow mover, it will take a while to reach the target
2. The volume when the stock is breaking out not quite big
Note:
Volume not dries up cause of big capital stock, some of big capital stocks doesn't need to dries up their volume

$NEST - POWER PLAYIDX:NEST - PRIMARY BASE
06-12-2024
(+):
1. Low risk entry point
2. Price surge up almost 100% since it’s IPO indicated that the stock is strong
3. Volume dries up with VCP characteristic during this tight pause
4. One of IPO leader after IDX:DAAZ
5. RS Rating is over 70 (80)
(-):
1. Not the best Power Play setup, on the textboox: There is an explosive price move up over 100% on huge volume within 8 weeks and not corrective more than 20%

BIPI Buy Position1. Trend Confirmation:
Identified a Change of Character by the break of the previous high at 81, indicating a reversal in market sentiment and a new bullish trend.
2. Fair Value Gap (FVG):
On the Weekly chart, identified Fair Value Gap between 69 - 71.
3. Trade Execution
Entry Price: 74 ( Engulfing Candle on 5 Nov 24)
SL: 66 (FVG)
TP1: 110 (1.618 Fibbo)
Risk-Reward Ratio (RRR): 1:4.5
Monitoring: Check-in daily closing price
4. Outcome:
Exit Price:
Profit/Loss: pips
-------------
Disclaimer
The analysis and content provided here are intended solely for personal journal and educational purposes. This information does not constitute financial advice, investment advice, or a recommendation to buy or sell any securities. Trading involves significant risk, and you should only trade with money you can afford to lose. Past performance is not indicative of future results. Always conduct your own research and consult with a qualified financial advisor before making any investment decisions.

TINS - (VCP 61W 110/14 4T)IDX:TINS (VCP)
23-09-2024
(+):
1. Low risk entry point, cheat buy on pivot point
2. Volume dries up
3. Confirmed Stage 2
4. Price above MA 50 > 150 > 200 over 10 weeks
5. Price is within 25% of 52 weeks high
6. Price is over 30% of 52 weeks low
7. 200 day MA trending up over 1 month
8. RS Rating is over 70 (91)
(-):
1. The breakout on pivot point is not big enough

BBRI Signal Strong Bullishbuy, sleep, 2025=WakeUp
kalian dapat set stop lost sesuai analysis berikut
let's go Q4 Rally !!!!

AMRT - Double BottomIDX:AMRT - DOUBLE BOTTOM
I bought the stock
10-09-2024
Reason to buy:
1. Double bottom break out with huge volume
2. Price over 50 and 200 MA
3. Low risk entry point

My longterm view of Jakarta Composite Index (IHSG) is BEARISH.. Based on Elliot Wave perspective, i could see the Composite Index now running on its end of wave 5. It made a huge and wide consolidation around 7k to 7.3k and most likely the consolidation will break and lead to bear season.
I recommend to SELL ON STRENGTH at this time, cause the highest chance for the next trend is bearish trend.
TARGET???
1st: 6500
2nd: 5500
possibly lower than 5000!
Stay alert!!

Black Swan Events: Recovery and Volatility of Key AssetsDespite the stark declines during the COVID-19 black swan event, assets like Bitcoin, gold, the S&P 500, and the Indonesia Stock Exchange demonstrated remarkable resilience, not only recovering but also soaring to new heights, showcasing the enduring strength of diverse investment portfolios. However, the recent escalation in the Israel-Iran conflict has again put pressure on these assets, causing a downturn as global markets react to the uncertainties. #Bitcoin #Gold #SPX #IHSG

SMGR completed wave and in progress of ABC waveSMGR look to complete the ABC wave.
I'm not export in wave, just share my personal ideas only.
Hope it works out.

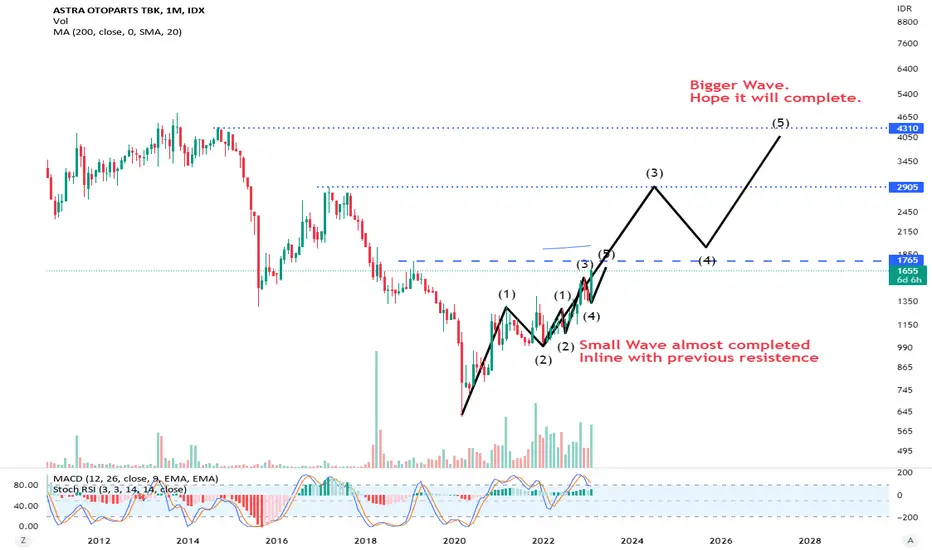
AUTO journey to complete next wave. See previous post as wellAs stated in previous posting, AUTO has completed the small wave and looking for bigger wave completion.
Still long journey but hope for the best.
BBRI : Rebound, Targeting Rp5750 pre-2024 Election VolatilityOn November 1, 2023, Bank Rakyat Indonesia (BBRI) stock exhibited a notable touch on the lower trendline at Rp4930. This technical analysis delves into the implications of this touch, marked by a bullish pattern and rapid ascent, further substantiated by the stock's position above the Exponential Moving Average (EMA) 200 and a positive MACD crossover. The objective is to explore the basis for the continuation of the upward trend with a potential target range of Rp5750 before the anticipated market volatility preceding the 2024 Indonesian elections.
Technical Analysis:
Lower Trendline Touch and Bullish Pattern:
- The touch on the lower trendline at Rp4930 signals a substantial support level, suggesting a potential trend reversal.
- The emergence of a bullish pattern reinforces the positive sentiment, indicative of a swift upward movement.
EMA 200 Position:
- The stock's positioning above the EMA 200 signifies a robust long-term momentum.
- The close proximity of the stock price to the EMA 200 provides additional confirmation of the potential for a sustained upward trend.
MACD Conditions:
- The MACD exhibits a bullish condition with a crossover of the signal line to the upside and a positive histogram.
- The bullish signal from MACD supports the notion that buyer momentum is on the rise.
Upside Target:
Upper Target (Resistance):
- Given the confirmation from the trendline, EMA 200, and MACD, the initial upside target is set around Rp5750 or higher.
- This level encapsulates potential technical resistance that the BBRI stock may encounter during its upward trajectory.
Additional Analysis:
Supplementary Indicators:
- Further confirmation from auxiliary indicators like RSI and trading volume is recommended to provide a comprehensive view of trend strength and market participation.
Market News Monitoring:
- The potential for market volatility leading up to the 2024 Indonesian elections underscores the importance of vigilantly monitoring market news and political developments.
Risk Considerations:
Stop-Loss:
- Effective risk management involves placing a stop-loss beneath the trendline or support level.
Conclusion:
In conclusion, BBRI stock presents a compelling case for a continuation of its upward trajectory, supported by the confirmation from the trendline, EMA 200, and MACD. With a potential upside target of Rp5750, investors should remain vigilant as the market navigates the uncertainties leading up to the 2024 Indonesian elections. Regularly updating analyses in response to evolving market conditions and seeking advice from financial professionals is advisable before making investment decisions.


MDKA Buy Speculation Analysist 30th May 2023MDKA is in down movement, probably gonna make price retracement (price probably at a support area right now).
Probably willing to buy in 3030 - 2800 area (average down recommended).
MDKA have probability to go down to 2770 (Stoploss when price hit 2770 or below)
Target Profit at 3600 (or take profit when 10% profit).
THIS IS FAST TRADE, so you can TP when you get 10% profit minimum.
Risk Reward ratio 1 : 2 to 3x
Good luck.

UNVR forms a wyckoff diagonal accumulation scheme ??UNVR is a consumer goods stock listed on the Indonesia Stock Exchange. UNVR forms a wyckoff diagonal accumulation scheme ?? currently the diagonal scheme is still unstable and may form horizontal. while waiting for that certainty, the price will try to touch the level of Rp. 5,000 before falling again.


Only Watch and Wait for NowToo many noise right now
Looks price can go up
But once again, I need more confirmation
I will start buying at 2 conditions
wait at support below
or
wait price until breakout the resistance
Just trade with your own decision
This analysis made just for education purpose
Disclaimer On

No Action Until...For now just a watchlist...
No need action until price above resistance..
But I think it has potential to grow again if price above that resistance
This analysis made just for education purpose
Trade with your own decision
DisclaimerOn

Buy IfHave some planning for this
1. Wait for breakout fib618
2. Averaging 2x, start from fib05 area and the second start from fib382 area
This analysis just made for education purpose only
Trade with your decision
DisclaimerOn
