Ils
USDILS Butterfly patternWe have the Butterfly pattern
To trade a bearish Butterfly pattern, place your sell order at point D (the 127% Fibonacci extension of the X-A leg), position your stop loss just above the 161.8% extension of the X-A leg and place your profit target at either point A ( aggressive) or point B (conservative).
Short entry
Stop loss
Conservative profit target
Aggressive profit target
summary
In this lesson, you have learned that …
... the Butterfly is a reversal pattern that allows you to enter the market at extreme highs or lows.
... it is similar to the Gartley and Bat patterns but the final C-D leg makes a 127% extension of the initial X-A leg, rather than a retracement of it.
... to trade the Butterfly, enter the market with a long or short trade at point D of the pattern - the price should reverse direction here.
... place your stop loss just below (bullish trade) or above (bearish trade) the 161.8% Fibonacci extension of the X-A leg.
...for an aggressive profit target, place your take profit order at point A.
... for a more conservative profit target, place your take profit order at point B.
USDILS is going to break 20years downtrend!!!Based on recent price action, it appears that USDILS may be primed for a bullish move. The USDILS chart has just closed its first monthly candle above a long-term downtrend trendline that has been in place for more than 20 years. This is a significant technical development that suggests a major shift in the currency pair's direction.
With this in mind, a potential trading idea would be to enter into a long position in USDILS at current levels, with a buy zone of 3.50-3.65. This range is based on previous support and resistance levels and should provide a good entry point for traders looking to capitalize on a potential breakout.
As for targets, the first level to watch for is 3.80. This level represents the next resistance zone that USDILS will need to overcome on its way higher. If the pair is able to break through this level, the next target to watch for is 4.15, which represents the previous swing high from 2018.
Of course, it's important to remember that trading always carries risk, and there are no guarantees in the markets. It's always wise to manage risk by using stop losses and other risk management strategies.
USDILS.. Important levels & Trend linesUSDILS.. Important levels & Trend lines
In light of the continuous and repeated raising of US interest rates, we most likely expect an upward strength of the US dollar, and in turn, the stability of the USDILS pair above 3.40 levels will push it to achieve more gains, especially in light of the current Israeli conditions, and the news that talks about its indirect intervention In the Russo-Ukrainian War.
It is worth noting that these levels are for the weekly term, not for daily trading, so you can consider them as a guide for the long term.
Do your research and apply proper risk management as nothing is guaranteed in forex trading. This is a high risk venture and past performance is not indicative of future results. Trade Responsibly!
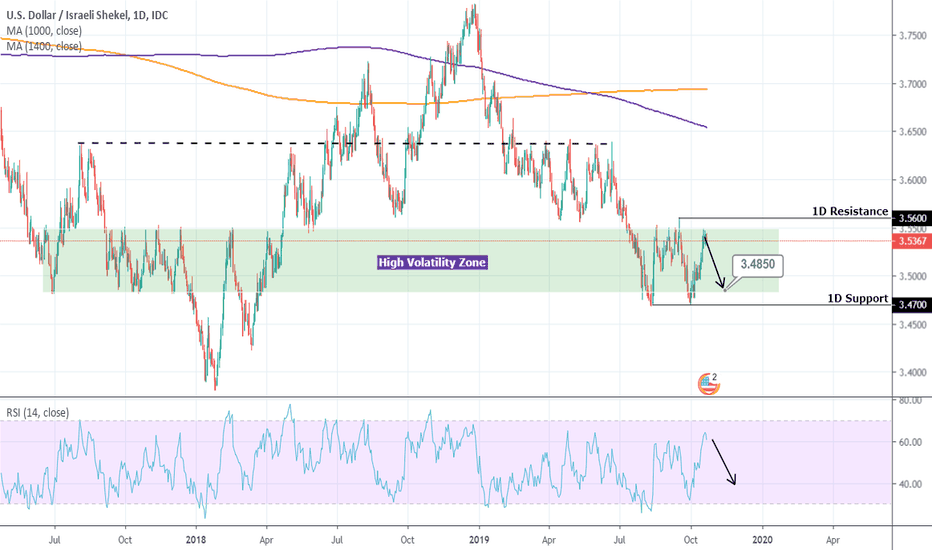
ridethepig | ILS Market Commentary 2020.04.29The first 3.50 test triggered development from the Bank of Israel, it shows how quickly the zone can be protected and the tables are turned. Intervention is clear, smelling it a mile off here and makes the short-term opportunity towards the highs an attractive option. When the CB like Israels comes out to say that the currency has gone too far and they wont hesitate to step in... you know the swing that follows from that will illustrate the use of fundamentals in particularly striking fashion.
The attack on EM FX raises the stakes; because we have the second iteration of the virus to come in the Southern Hemisphere and another leg lower to track in Global Equities. We can keep an ear to the ground on local Israeli politics, without any surprises a leg back towards the top in the range looks imminent. Will look to dial back below 3.50.
Thanks as usual for keeping the likes, comments, charts, questions and etc coming!
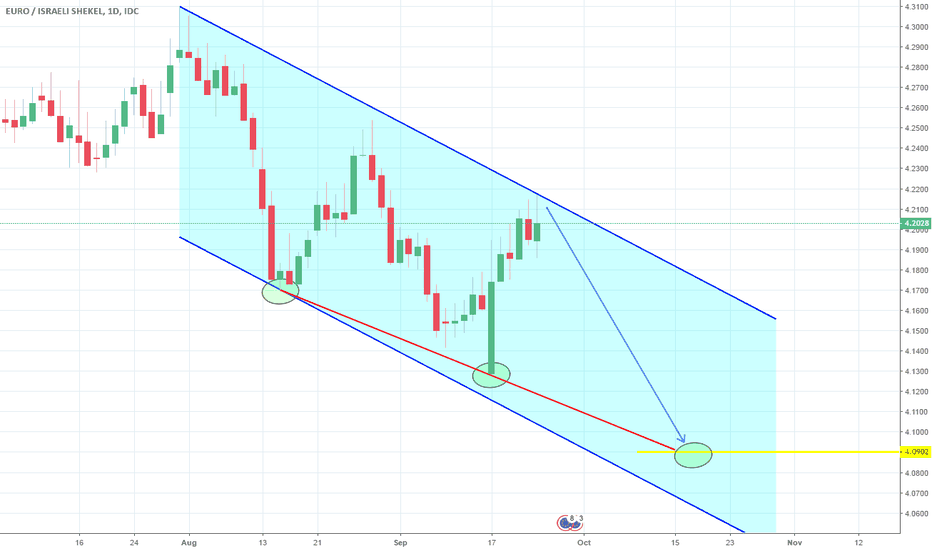
EURILS: Sell entries.EURILS has been trading within a long term Channel Down since December 2018 (RSI = 38.590, MACD = -0.085, ADX = 31.136, Highs/Lows = -0.0915). At the moment it is trading around the 1D MA50 and on the Lower High trend line. We expect the price to be rejected back to the 3.7790 Support. If not, then the June - December 2018 fractal may be played out: rise towards 3.9500 and then rejection.
Previous call within the Channel Down:
** If you like our free content follow our profile (www.tradingview.com) to get more daily ideas. **
Comments and likes are greatly appreciated.
EURILS: Further downside expected.The pair is on a strong 1M Channel Down (RSI = 37.575, MACD = 0.082, Highs/Lows = -0.1355) since the beginning of the year. We are expecting another test of the 3.7870 1D Support. Based on the RSI (despite being a bullish divergence) we are expecting a symmetric low outside the Channel. That should be the 3.7870 contact.
** If you like our free content follow our profile (www.tradingview.com) to get more daily ideas. **
Comments and likes are greatly appreciated.
USDILS: Rising Wedge within a Channel Up. Buy opportunity.The pair is trading on a Rising Wedge within a wider 1D Channel Up (RSI = 59.015, MACD = 0.014) and the neutral Highs/Lows (0.0000) indicate that it is close to pricing a Higher Low. The long's obvious TP is the Wedge's Resistance at 3.7900 but if it breaks we will extend the buying to 3.8200.
** If you like our free content follow our profile (www.tradingview.com) to get more daily ideas. **
Comments and likes are greatly appreciated.
USD/ILS 1H Chart: Pair waits bullish confirmationUpside risks dominated the USD/ILS exchange rate after the pair reversed from the lower boundary of a long-term ascending channel located at 3.5758.
The rate is trading near the upper boundary of a short-term ascending channel. Given that the currency pair is supported by the 55-, 100– and 200-hour SMAs, it is likely that a breakout from the junior channel occurs during the following trading sessions. A potential upside target is the monthly R2 at 3.6912.
By the large, it is expected that the exchange rate continues its increase until the Fibonacci 0.00% at the 3.7177 mark.
USD/ILS 1H Chart: Senior channel in sightThe Israeli Shekel has been appreciating against the US Dollar since the beginning of August after the pair reversed from the upper boundary of a medium-term channel at 3.7237.
As apparent on the chart, the pair is testing the lower channel line at 3.5700. From the theoretical point of view, a reversal and a breakout from a junior descending channel could occur in the nearest future Technical indicators for the 1W time-frames also support bullish scenario. A possible upside target for the following sessions is the 100-period (1D) SMA at 3.6233.
In case the Fibonacci 38.20% retracement at 3.5968 is not surpassed, the pair could breach the senior channel and aim for the weekly PP at 3.5430.
USD/ILS 1H Chart: New medium pattern takes overThe situation on the USD/ILS charts is initially hard to understand, as the already broken patterns are still drawn on the chart.
Namely, the previously active ascending medium term pattern is still observable on the charts. However, one should concentrate on the new medium term descending pattern.
In the borders of that pattern a junior channel up pattern has already guided the currency rate up to the resistance line of the medium term pattern.
In regards to the near future, the pair is set to get squeezed in between the various hourly SMAs, lower trend line of the junior pattern and the resistance line of the medium term pattern. If the dominant pattern holds its ground, the squeeze should end in a break out to the downside.
USD/ILS 1H Chart: Wedge continues to restrict pairThe prevailing pattern for the USD/ILS exchange rate is a six-week falling wedge. The rate entered this pattern from the downside on April 24. It has since provided two confirmations on each side and is gradually moving towards a breakout.
The bottom boundary of this pattern is reinforced by SMAs on the 4H and 1D time-frames. Thus, it is likely that the Greenback is pressured higher this week. The nearest upside target is the upper wedge line at 3.59. The strength of this area could push the rate back lower until a southern breakout occurs.
In case the 3.59 area surrenders, the US Dollar is expected to target the monthly R1 and its one-year high at 3.64.
USD/ILS 1H Chart: Senior channel dominates The US Dollar has strengthened against the Israeli Shekel since mid-March. This upward movement has allowed the rate to move from the bottom boundary of a senior channel up to its upper line and the monthly R1 near 3.6360.
The pair changed its sentiment during the previous trading weeks, thus falling down to 3.5770 mid-Monday. It seems that the following trading session or two might mark a reversal to the upside.
This movement, however, should not be long-lived, as the 200– and 100-hour SMAs and the 55-period SMA (on 4H chart) are located at 3.60. It is expected that the pair fails to overcome this mark and resumes its decline down to the senior channel in the 3.50/52 area.
In case the 3.60 mark is breached, traders should see a further surge up to the medium-term channel and the nine-month high of 3.64.


