Smart Money SHORT | AUDNZDNot a trade i am going to take personally as I don't like the size of the spread on this pair and its not something I typically trade.
But if you trade this pair, then this could be a decent trade for it.
Imbalance

Shark Almost CompleteShark is almost completed and D leg lands inside demand zone and fills an imbalance.
Limit sell order - 1.28167

GBPNZDHello Traders Welcome back to another profit day
If you like my idea please give me a like and comment, That's will be a great appreciation to do more predictions
Here is the full analysis for this pair, Let me know in the comment section below if you have any questions, the entry will be taken only if all rules of the strategies will be satisfied. I suggest you keep this pair on your watchlist and see if the rules of your strategy are satisfied.
GBPNZD view with 15 M POI (OB) 1:15 RR
Remember this analysis is not 100% accurate No single analysis is To make a decision follow your own thoughts.
The information given is not a Financial Advice.
Please support this idea with a like, if you find it useful

GBPUSD UpdateThe drop to 1hr demand and the price did change in that area which is what I expected - although it was very choppy yesterday on its way back up to the 1hr Supply I'm not sure the drop is coming yet.
As much as I would love to see the lower areas of imbalance cleared out I will sit and wait for the right opportunity to present itself.
Note: If the Daily high gets broken with a candle closure then the short would be invalid - this area it is in now is a more probable area for sells down below 1.38000 -
DOES NOT mean it going to happen it's just from the way I am looking at the market structure. ALWAYS work out what Market Range you are trading in

Bat, Descending Flag & ImbalanceWe have a descending flag here on the 6H + charts along with a bat pattern thats nearing completion,
Im waiting for confirmation to enter to complete the C to D leg, the D point also covers previous imbalance, we hav a good potential short here.

USD/CAD - Movement Lower?Currently very overextended to the upside.
We are testing a strong Orderblock in Premium that lines up perfectly with the OTE of the Fib taken from the Higher High.
There are several imbalance levels that should get filled in.
We have an un-manipulated Trendline that has lots of retail money on it, therefore we should see price reach there to manipulate this level.
There's also a W formation on the H1 timeframe that the market should trace towards - the neckline (where it says "First Target". Should we reach through this level I'm expecting price to reach down into the Bullish Discount Orderblock that we should see a reaction happen within.
As much as I don't like indicators, I use the RSI occasionally to find divergence / overbought / Oversold levels. Inside this bearish orderblock we are currently testing, we are very overbought, meaning that we should see price make a move down.

USDCAD Sell to Buy Short term USDCAD may come down to test the demand zone below the 1HR imbalance before higher prices as dictated by weekly dollar bullish outlook

Drop below the 50% of initial Push for possible buying?This is NOT to say this is the path it will take but just the ideal scenario - the 1hr Demand and 1hr supply are the first areas that need to be noted for a possible reaction.
Loads of imbalance below down in the Daily Demand zone so ideally this is the area where buying opportunities will come from should price drop down there.
See how the market goes tomorrow then will update on how I reacted and any trades that I take.

Smart Money SHORT | NZDCADLooking at NZDCAD we are in a Daily POI
switching down to the lower TF's we have a BOS and a last area os supply.
Lets see how price delivers from here

Smart Money LONG | AUDCHFLooking at AUDCHF we tagged a 4HR POI, The order flow then slowed down, and now we have had multiple breaks of structure on the lower timeframes
We will have to see how price delivers itself, if the high that has formed is broken for me it will become invalidated
Any questions feel free to ask

Deep Crab CompletedUS30 - Bullish Deep crab Completed, higher timeframe trendline respected & Imbalance filled, I'm looking for at least a 50% retracement here!
Smart Money SHORT | EURAUDLooking at the structure of EURAUD
Currently bearish on the lower TF's but if we break this lower timeframe structure it could be time to look for longing positions as on the higher timeframes we are still very bullish
Let's see how it pans out

Smart Money LONG | GBPUSDLooking at GBPUSD at the last 5min imbalance that was left behind, lovely potential entry
Lets see how it plays out

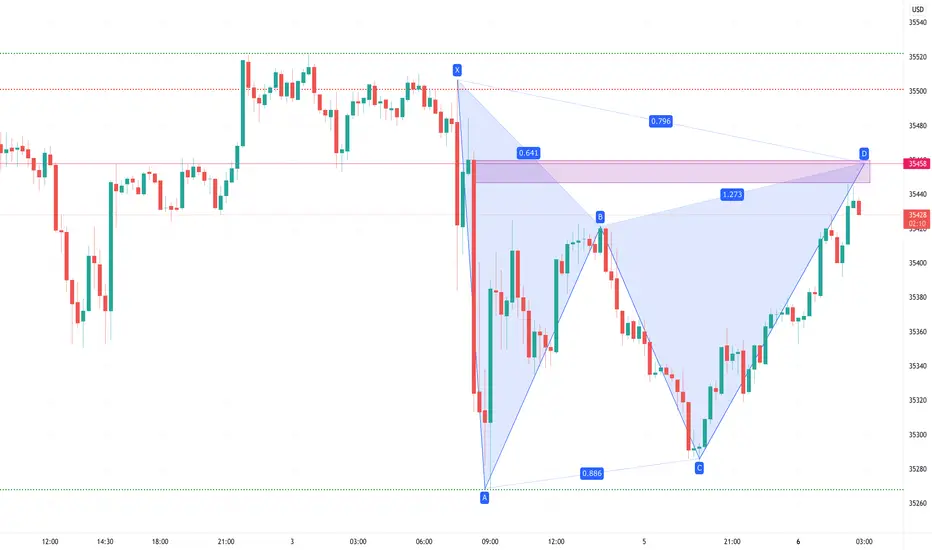
Gartley Almost CompleteWe have a Gartley on the LT that's almost completed with the D point also landing inside a point of imbalance.
Im waiting for price to hit this area of potential PRZ and because of lower TF it will be a smaller retracement before price continues to the upside towards the higher demand zones! (Price action is still bullish)
This could bank us an easy 20/30 pips keep an eye on the 35460, if you see a reversal jump in the trade with a small SL
BUY GOLDGold is in a bullish trend after breaking market structure on the daily timeframe. Price just needs to retrace back to 1800 zone/ orderblock that formed after BMS, and then we'll load buys to 1850/1869 to fill up the imbalance.

Smart Money LONG | XAUUSDLooking at gold we are still continuing our trend to the upside.
Currently have 1 position already open, looking to execute anything one if we can get the desired pullback to the area I need.
Lets see how the market accumulates itself and see if we can get tagged in.
Any questions feel free to ask
Ben

Weekend Analysis + Market Re-cap Looking at some good trades i took on AUDJPY this past week
Also breaking down some of the pairs in which I am looking for some possible trend continuations or trend reversals based on the market structure that presents itself.
Any questions on the analysis please do let me know via a comment or message.
Take Care
Ben

Short Sell, Long BUYAfter BMS at 1.3753, price retested the nearest OB on daily and rallied up. We continue to see the rally and we have just filled an imbalance in 1D. We could see some sells from here.
Alternatively, we could continue to rally up to the weekly OB at 1.4065 where we will look for sells

Smart Money LONG | NZDCHFWaiting for price to pull back to the 15min POI after creating this Wyckoff re-distribution
Thoughts?

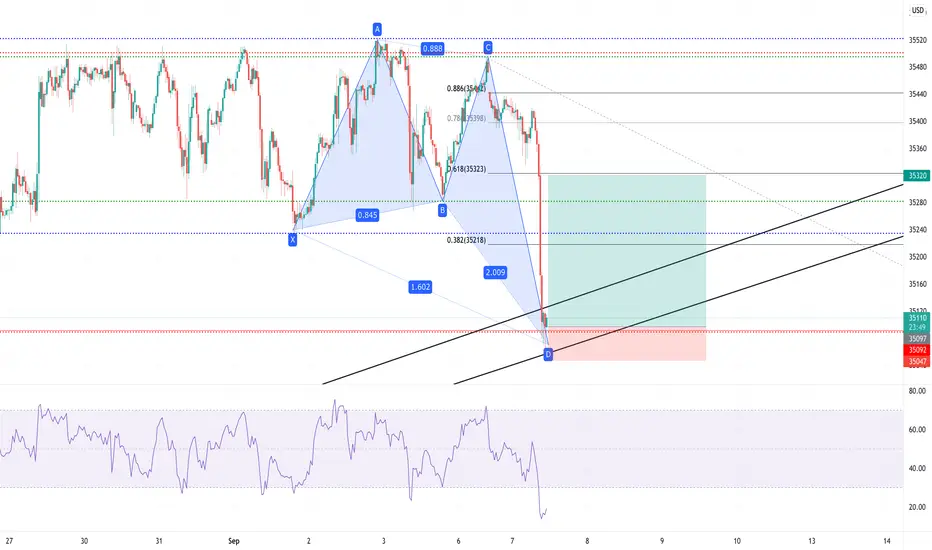
Potential SharkPotential shark forming on 15M, i'm waiting for price to break to the downside before entering this short as price action is bullish on higher TF, but I'm expecting price to reject from this resistance level giving us a retracement (Hopefully down to at the .86) As there is another nice imbalance there that needs mitigating.
If price breaks structure to the upside then this potential trade will be invalidated.

Potential Shark Potential shark with bullish price action to miss previous imbalance at .86 or 1.13 (If the .86 breaks)
I'm not taking this trade I'm going to watch price action and if it hits either one of the sharks D points and covers previous imbalances then ill look to take this short.

Smart Money SHORT | EURUSDLooking here at EURUSD 2 potential selling areas.
we could move lower from the first 5min POI or the 2nd one could be the better entry.

BUY GBPUSDWe've broken market structure on the daily timeframe and now retesting the BMS, thus the buy at current market price. It is also possible to see a retracement to the market zone which will give us buys at a discount
