META Slows Down For A Correction Within UptrendMeta has seen a strong recovery recently, but barely retested February highs around 740, from where we can see some nice pullback, but it appears corrective, since it’s unfolding in three waves, and forming a potential bull flag — likely wave 4. A breakout above the downward channel on a daily close could signal the start of wave 5 and a push to new highs.
However, keep a close eye on the 666.1; a break below this level would invalidate the bullish view and suggest a deeper consolidation phase may follow.
Highlights:
Direction: Up (pending breakout)
Structure: Wave 4 bull flag; wave 5 possible soon
Support: 680 / 690
Impulse

ACT TOKEN - Price can fall to support area and then bounce upHi guys, this is my overview for ACTBUSD, feel free to check it and write your feedback in comments👊
The price was trading within a descending channel for a considerable period.
The asset consistently found support at the lower boundary of this formation, within the 0.0590 - 0.0570 price zone.
Recently, a strong upward impulse allowed the price to break out from the upper boundary of the channel.
Following the breakout, the price executed a corrective move back to the broken resistance line, successfully retesting the 0.0730 - 0.0750 area.
This zone is now acting as a new support level, and the price has begun to move upwards from it, showing renewed buyer strength.
I expect that the asset will continue its growth from this support. My first target is set at the 0.0860 level, with the second target at 0.0970 points.
If this post is useful to you, you can support me with like/boost and advice in comments❤️

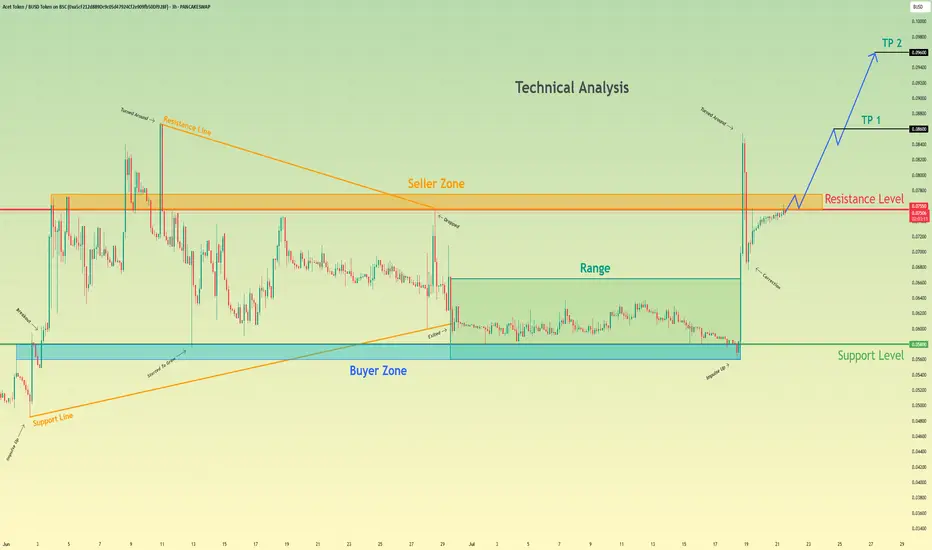
Acet Token will break resistance level and continue to move upHello traders, I want share with you my opinion about Acet Token. Looking at the recent price action, we can see a clear narrative unfolding. The asset initially formed a large wedge pattern, experiencing a trend reversal that led to a breakdown and a period of prolonged consolidation within a defined range between the buyer zone around 0.0580 and the upper boundary. Recently, however, the market showed a strong impulse, breaking out of this range and decisively moving upwards. Currently, the price of act is testing the key resistance level at 0.0755, an area historically defined as a seller zone. The hypothesis is that after this powerful impulse, the asset will manage to break and hold above this resistance. A successful retest of the 0.0755 level would likely signal a continuation of the uptrend, paving the way towards our specified take-profit targets. The first goal is set at TP 1 at 0.0860, with a further extension to TP 2 at 0.0960, capitalizing on the anticipated bullish momentum. Please share this idea with your friends and click Boost 🚀
Bitcoin Is Looking For A Bullish ContinuationMorning all! Bitcoin has impulsive characteristics on 4h time frame, and we can clearly see five waves up that can send the price even higher after recent projected ABC correction. With the current impulsive recovery back above 106k area, it confirms that bulls are still here and we should be aware of further rally in July, especially if breaks above channel resistance line near 110k area. Seems like it's in wave (1) of a new five-wave bullish impulse, so after current wave (2) pullback, we can expect more gains within wave (3).

ARTY - Play-and-Earn Launch Poised to Ignite Rally Toward $1.80Hi guys, this is my overview for ARTYUSDT, feel free to check it and write your feedback in comments👊
After consolidating in a flat range between $0.36 and $0.74 for months, ARTY triggered a bullish breakout, climbing rapidly toward $1.83.
Following this surge, price corrected back to the $0.27–$0.36 support area, which absorbed selling pressure and formed a reliable accumulation base.
On June 30th, Artyfact will launch its inaugural Play-and-Earn mode, poised to attract hundreds of thousands of new users and significantly boost ARTY demand.
This upcoming catalyst underpins the bull case, reinforcing buyers’ confidence and justifying another leg higher from current levels near $1.62.
Key downside support remains at $1.00–$1.08, where any retracements could offer favorable long entries ahead of resumed uptrend momentum.
My three upside targets are $1.00 for the first level, $1.40 as intermediate resistance, and $1.80 near the previous all-time high.
If this post is useful to you, you can support me with like/boost and advice in comments❤️

GateChain Slows Down Within An Impulsive Bullish TrendGateChain with ticker GTUSD came slightly lower, but we still see it trading in a higher degree wave »iv« correction that can resume the bullish trend for wave »v«. It can be actually finishing final subwave (c) of a three-wave (a)(b)(c) corrective decline, so keep an eye on strong support here at the former wave (iv) swing low and 38,2% Fibonacci retracement. If we get sharp rebound and impulsive rise back above channel resistance line near 20 bullish confirmation level, then we can easily expect further rally within final wave »v« of 5 this year, which can push the price even up to 35 – 40 target area.

BTC- New Impulse Soon You Can See read captionbitcoin (BTC) – Bullish Outlook
Price action breaking above key resistance, signaling potential trend continuation
Strong volume supports the move, confirming buyer strength
Higher highs and higher lows forming—classic bullish market structure
RSI and MACD both showing bullish divergence
Next target zone: TSXV:XX ,XXX – watch for consolidation or breakout
Overall sentiment shifting positive with macro tailwinds

BTC - New Impulse Soon!Hello TradingView Family / Fellow Traders. This is Richard, also known as theSignalyst.
📈 BTC has been bullish, trading within the rising channel marked in orange. 🟧
In a typical trend, corrections are usually bearish. 🔻
However, in BTC’s case, the correction phases marked in red are flat — a strong signal that the bulls are in control 💪 and not allowing the bears to trigger a classic pullback.
As long as BTC holds within the rising orange channel, we expect the next impulse phase to kick off soon 🚀 — aiming for the $115,000 round number. 🎯
This move will be confirmed once BTC breaks above the current flat correction zone marked in red. ✅
📚 Always follow your trading plan regarding entry, risk management, and trade management.
Good luck!
All Strategies Are Good; If Managed Properly!
~Rich

Gold Completes A Correction Within Bullish TrendGold made another sharp leg to the upside in first half of April, even showed some accelerating price action away from the 3,000 level. This suggests it might have been part of wave three when looking at the Daily and 4-hour time frame, so there can be more upside within a much more extended impulse structure. Possibly already now after blue wave four consolidation shows first signs of a bottom near 3120. Notice that pullback from recent high is in three legs, while price recovered out of wave (C) channel, so looks like new recovery is in the cards.

NIFTY Resumes Its Bullish TrendHello traders! Today we will talk about an Indian stock market exchange NIFTY 50, as we see nice and clean pattern from technical and Elliott wave perspective.
As you can see, NIFTY is in an impulsive bullish rise on the weekly basis, which looks like a higher degree wave 3 of an ongoing five-wave bullish impulse by Elliott wave theory.
After recent corrective slowdown in subwave (4), which perfectly tested channel support line and 38,2% Fibonacci retracement, we can now see it extending even higher, ideally for subwave (5) of a higher degree wave 3 that can push the price even up to 28k-30k area this year, just watch out on short-term pullbacks.

BlackRock's Bitcoin ETF Can Be Unfolding A Bullish ImpulseBlackRock's Bitcoin ETF with ticker IBIT made a massive rally in 2024, which can be wave 3 of an ongoing five-wave bullish impulse. Despite the recent decline at the beginning of 2025, it's still above 42 invalidation level, and as long as it's above that level, it can be wave 4 correction, so we may still see that 5th wave this year.
The Elliott Wave Principle is a form of technical analysis that identifies patterns in market movements. A bullish impulsive wave is one of the most important and common wave structures in an uptrend. It describes how prices typically move in the direction of the main trend. A bullish impulsive wave consists of five waves labeled 1, 2, 3, 4, 5.

EURUSD - Trade The Impulse!Hello TradingView Family / Fellow Traders. This is Richard, also known as theSignalyst.
📈EURUSD has been bearish trading within the falling wedge pattern marked in red.
Currently, EURUSD is retesting the upper bound of the wedge.
Moreover, the $1.12 is a strong weekly supply zone.
🏹 Thus, the highlighted red circle is a strong area to look for sell setups as it is the intersection of the upper red trendline and supply.
📚 As per my trading style:
As #EURUSD is hovering around the red circle zone, I will be looking for bearish reversal setups (like a double top pattern, trendline break , and so on...)
📚 Always follow your trading plan regarding entry, risk management, and trade management.
Good luck!
All Strategies Are Good; If Managed Properly!
~Rich
Disclosure: I am part of Trade Nation's Influencer program and receive a monthly fee for using their TradingView charts in my analysis.

Ripple May Face Another Rally This YearRipple with ticker XRPUSD hit all-time highs for the final blue wave V as expected, so we should be aware of limited upside this year. However, despite recent slowdown, which we see it as an ABC correction within red subwave (IV), there can still be room for another rally this year, at least up to 4-5 area to complete final subwave (V) of V of an impulse on a daily chart.

Cable Is Trading Impulsively HigherCable is making a very nice and strong extension higher on the 4-hour time frame, so it appears to be impulsive. We should be aware of further upside, especially as the market has broken out of a base channel, which typically happens within wave three of three.
In fact price is now even higher after a triangle in wave four so wave 5 of red (3) is in progress as expected, but it can target 1.32, so be aware of a new red higher degree wave (4) correction before the bullish trend for wave (5) resumes. Ideal support is at 1.29 – 1.28 area.

#AVAX/USDT Short-term riseHello traders!
There is an upward wave and the price is declining in a correction . I expect a similar upward wave. We have an POI Zone and I expect the wave to start from there.

World Index Shows 5Th Wave Is Still MissingWorld Index ETF with ticker TSX:XWD has extended its rally for 261,8% Fibonacci retracement, which is ideal zone for wave 3, so current slow down can be just a higher degree ABC correction in wave 4. It’s now testing interesting and important textbook support at the former wave 4 swing low and 38,2% Fibonacci support area, from where we may see a bullish resumption for wave 5 this year. Invalidation level is at 90.

EURNZD Potential declineHello traders, we have a downward wave and a correction pattern. Another downward wave is expected.

HelenP. I Euro may fall to trend line and then rebound upHi folks today I'm prepared for you Euro analytics. Looking at the chart, we can see how the price traded near Support 2, which coincided with the support zone, before breaking this level and dropping to the trend line. Upon reaching the trend line, EUR turned around and started to rise. In a short time, the price climbed back to Support 2, broke it, and then made a retest. After this movement, EUR continued moving up and eventually reached Support 1, which also aligned with another support zone. The price traded within this area for some time before breaking Support 1 and then started trading near this level. Later, the Euro rebounded from this area and attempted to push higher but failed, leading to a decline. It quickly dropped to the support level, and more recently, the price even reached the trend line before bouncing back up. At this point, I expect EURUSD to correct toward the trend line before continuing its upward movement. Based on this scenario, my gaol is set at 1.1050 points. If you like my analytics you may support me with your like/comment ❤️

GBPUSD - SHORTConsider the development of a strong South Impulse. Sell on a false breakout or current price level! Target the lower Demand Zone.
GBPUSD - SHORT
ENTRY PRICE - 1.29420
SL - 1.30700
TP - 1.26240
Always follow the 6 Golden Rules of Money Management:
1. Protect your gains and never enter into a position without setting a stop loss.
2. Always trade with a Risk-Reward Ratio of 1 to 1.5 or better.
3. Never over-leverage your account.
4. Accept your losses, move on to the next trade and trust the software.
5. Make realistic goals that can be achieved within reason.
6. Always trade with money you can afford to lose.
Please leave your comment and support me with like if you agree with my idea. If you have a different view, please also share with me your idea in the comments.
Have a nice day!

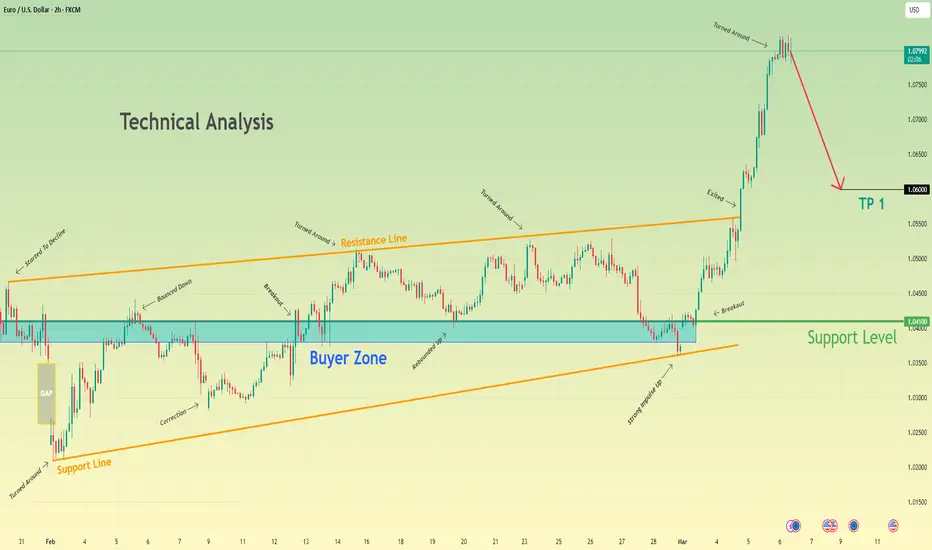
After strong impulse up, Euro makes correction to 1.0600 pointsHello traders, I want share with you my opinion about Euro. Looking at the chart, we can see that the price entered a wedge formation and immediately started to decline. The Euro broke through the 1.0410 level, creating a strong gap before reaching the wedge's support line and beginning to rise. In a short time, it climbed back to the support level and attempted to break it but failed, pulling back slightly. After that, the Euro returned to the 1.0410 support level and finally managed to break through. Following this move, it reached the resistance line of the wedge and made a correction down to the support level. Then, the Euro pushed back up to the resistance line, consolidating near it for a while before dropping to the buyer zone, where it later touched the wedge’s support line again. From there, it made a strong upward impulse, breaking the 1.0410 level once more, exiting the wedge, and surging to 1.0820. However, more recently, the price reversed and started to decline. I believe the Euro may enter a corrective phase after such a strong upward move. Based on this, my TP is set at 1.0600 points. Please share this idea with your friends and click Boost 🚀
Possible rise in the US30 indexHello traders
The current impulse wave is upward and the correction is over. Another impulse wave may start upward from here.

US Dollar Is Falling ImpulsivelyTrump tariffs and trade wars continue to dominate the market, and we have seen a strong sell-off in the US dollar recently. This reinforces the idea that the US may not win this battle easily, as some other countries have already responded and are trying to hit back. So it’s not a surprise that in this uncertainty stocks are also in a consolidation, but approaching a potential support.
Finally the USD is coming down, now breaking some key support at 106 which is an important indication for a resumption of a downtrend, especially if we consider that the current sell-off is sharp and can be third of a third wave.
So, a bearish trend can stay in play for much lower levels, mainly because Tariffs are delayed again, until April 2nd. Markets are stabilizing and recovering, while USDollar - DXY remains under bearish pressure with space for more weakness. Risk-On sentiment back?

#ADAUSDT is forming a strong bullish trend📈 LONG BYBIT:ADAUSDT.P from $0.8110
🛡 Stop Loss: $0.8046
⏱ 1h Timeframe
🔹 Overview:
➡️ Price is showing a strong uptrend after a correction, forming a support zone and bouncing off the local trendline.
➡️ POC (Point of Control) at $0.7826 highlights the key volume area where the reversal occurred.
➡️ Key resistance levels are marked, indicating potential price targets.
➡️ Volume spikes confirm increased buyer interest, signaling momentum.
➡️ An impulse breakout is possible if buying pressure sustains at TP levels.
⚡ Plan:
➡️ Main scenario – long position with profit-taking at TP levels.
➡️ Expecting a breakout above $0.8110 and resistance level tests.
🎯 TP Targets:
💎 TP 1: $0.8160
🔥 TP 2: $0.8210
🚀 TP 3: $0.8262
📢 BYBIT:ADAUSDT.P is forming a strong bullish trend — preparing for resistance breakouts!
