USDCHF Bear Market ContinuesUSDCHF Had a recent major sell-off not so long ago, chances are the bear market will continue to occur. The current move is a potential impulse move although we have to see wave 4-5 unfold and afterwards we will see a bigger A-B-C zig-zag correction pattern before the market rallies again.
To be fair on the higher timeframe we are bullish but we will have periods of pullbacks.
Impulse

EUR/USD MonthlyEURUSD impulsive move to the upside after we broke structure
our target or POI is inside premium and from there we can short


END OF CORRECTIONWEEKLY OUTLOOK ON BTC
Bitcoin is currently about to end correction move...
We are also seeing Breakout and retest of the channel...
But 12K might be test before starting the Impulse phase of this market ...
This is just analysis ...
Comment are highly welcome ...
Let me know your views on this ...
Thanks..
Like and share

EURUSD I It will correct downward from resistance zone Welcome back! Let me know your thoughts in the comments!
**EURUSD - Listen to video!
We recommend that you keep this pair on your watchlist and enter when the entry criteria of your strategy is met.
Please support this idea with a LIKE and COMMENT if you find it useful and Click "Follow" on our profile if you'd like these trade ideas delivered straight to your email in the future.
Thanks for your continued support!
Brian & Kenya Horton, BK Forex Academy

GBPUSD - SHORTConsider the formation of South Impulse from Major Resistance Level. Sell on a false breakout! The target is Major Support Level.
GBPUSD - SHORT
ENTRY PRICE - 1.14700
SL - 1.16600
TP - 1.08400
Always follow the 6 Golden Rules of Money Management:
1. Protect your gains and never enter into a position without setting a stop loss.
2. Always trade with a Risk-Reward Ratio of 1 to 1.5 or better.
3. Never over-leverage your account.
4. Accept your losses, move on to the next trade and trust the software.
5. Make realistic goals that can be achieved within reason.
6. Always trade with money you can afford to lose.
Please leave your comment and support me with like if you agree with my idea. If you have a different view, please also share with me your idea in the comments.
Have a nice day!

XAUUSDH1The price pulled back and failed to update new high.
Think go down and test support from resistance.
My goal is the support at 1620

GBPAUD - Fibo levels & Fake breakoutHere we explain further an analysis we dropped yesterday on GBPAUD.
We said that the pair is showing bearish behavior and mentioned that it should go further down to buyers liquidity level, however the pair rebounded upward shortly after. We immediately updated that it was a mere correction and this video explains how and why.
We hope you find this useful.
Love, Lacasafxfamily

A possible drop in the price of goldhello traders
The sellers were able to break the wall of the buyers with strong momentum. If the buyers reaction is corrective, I will wait for a reversal signal from the support and resistance area or the supply area to take a sell trade to target the bottom

CAD CHF SWING TRADE (SHORT)hello traders
There is a bearish impulsive wave and we have a correction in the form of an expended flat. We expect to get another bearish impulse wave, so we have a good selling opportunity

GBPCHF SHORT TRADE hello traders
We note the weakness of the british pound and it is expected to decline against most currencies and We have a good entry point to sell the British pound against the Swiss franc

GBPJPY Analysis Ahead of CPI Inflation ReportWelcome back! Let me know your thoughts in the comments!
**GBPJPY - Listen to video!
We recommend that you keep this pair on your watchlist and enter when the entry criteria of your strategy is met.
Please support this idea with a LIKE and COMMENT if you find it useful and Click "Follow" on our profile if you'd like these trade ideas delivered straight to your email in the future.
Thanks for your continued support!
Brian & Kenya Horton, BK Forex Academy

CADJPY Impulse Correction ContinuationWelcome back! Let me know your thoughts in the comments!
**CADJPY - Listen to video!
We recommend that you keep this pair on your watchlist and enter when the entry criteria of your strategy is met.
Please support this idea with a LIKE and COMMENT if you find it useful and Click "Follow" on our profile if you'd like these trade ideas delivered straight to your email in the future.
Thanks for your continued support!
Brian & Kenya Horton, BK Forex Academy

MDX - Fair Value Gap TakenI covered this in my recent YT video that we had a fair value gap in the yellow box area.
Price (especially short squeezes) tend to fill this gaps sooner or later.
I had also marked out those key levels to look out for as targets (dotted lines).
Mdex smashed both of them with hast, filling the FVG now.
Is this the start to a real trend? (I wouldn't be longing here).

GBPJPY ImpulsesI have been tracking the impulses of GBPJPY.
In the past 10 days, the average impulse in around 367pips. of course, that is b/c a couple really big plays without it the average comes to around 260-300. I've noticed that GBPJPY impulses at the end of a consolidation periods. Capturing such a move would be a nice add to the trading account. I can see why GBPJPY can help you build up account, as well as Blow your account quickly, if you do not have your S/Ls set. GBPJPY has a tendency to sweep the S/L's and reclaim its position, very quickly.
Also, Using RSI on this chart hasn't worked recently. seems to go the opposite way.
I will continue to track impulses while watching if volume reveals anything to help encourage the impulses.
Hope you enjoy!

USDCAD Is Looking Higher Within A Five-Wave ImpulseUSDCAD is breaking higher, now making some extended upward move which is acting like an impulse because of an extended and sharp move up from 1.3. As such, we think this can be impulse wave 3 where pair can slow down for a corrective pullback into wave four. Ideally that upcoming wave four will then stop and stabilize at the upper line of a base channel.
Trade well!
If you like what we do, then please like and share our idea.
Disclosure: Please be informed that information we provide is NOT a trading recommendation or investment advice. All of our work is for educational purposes only.

VET/BTC Expanding Triangle Clamping the price before the impulseLocal trend. Time frame 1 day. Expanding triangle.
Coinmarketcap: VeChain
Price squeeze during “market doubt”.
A zone of price squeezing in a narrow range at the moment of uncertainty (doubt) of the market in general.
Clamped by large orders in the required buy/sell range on liquid exchanges. The range is spammed with orders, basically a bot is triggered to make the trades visible and to “protect” the large orders (so as not to “grizzly”, but if they gnaw—"go down steam"). Small exchanges themselves will “pull up” in price over time.
It works the same way (first of all) in pairs also to dollar, but the step is bigger (it is more difficult to hold a range). In pairs to bitcoin, it's easier to do due to smaller % of step (crypto price). The lower the price in satoshi, the more effective step clamping (range holding) is done.
Unfortunately, here on the site it is impossible to show the order stack, it would be more obvious, the chart is a consequence, not the root cause.
The meaning of the action—before a strong impulse up/down price movement, does not matter. You, unlike hamsters (those who are constantly losing money) cannot know exactly in which direction the market will locally go. The impulse (exit) is made under the general market trend (direction of movement). There are exceptions, but it is more about low liquid altcoins during the so-called “market window” (it is now). It helps a lot to move the price impulsively at such moments (decoupling):
1) stops (“market fuel”)
2) scalpers of course
3) oppositely tuned (in most cases, but not always) crowd (the main market participants) at the moment, that is the cloned behavior of people.
This is what the expanding triangle area looks like on a line chart.
This is what this "price squeeze" looks like locally.
On a linear to understand the without the "market noise".
The graph is a consequence of the sense of action in the glass.

GBPCAD New rising trend line +300 pips Welcome back! Let me know your thoughts in the comments!
**GBPCAD - Listen to video!
We recommend that you keep this pair on your watchlist and enter when the entry criteria of your strategy is met.
Please support this idea with a LIKE and COMMENT if you find it useful and Click "Follow" on our profile if you'd like these trade ideas delivered straight to your email in the future.
Thanks for your continued support!
Brian & Kenya Horton, BK Forex Academy

EURGBP Impulse Correction ContinuationWelcome back! Let me know your thoughts in the comments!
**EURGBP - Listen to video!
We recommend that you keep this pair on your watchlist and enter when the entry criteria of your strategy is met.
Please support this idea with a LIKE and COMMENT if you find it useful and Click "Follow" on our profile if you'd like these trade ideas delivered straight to your email in the future.
Thanks for your continued support!
Brian & Kenya Horton, BK Forex Academy

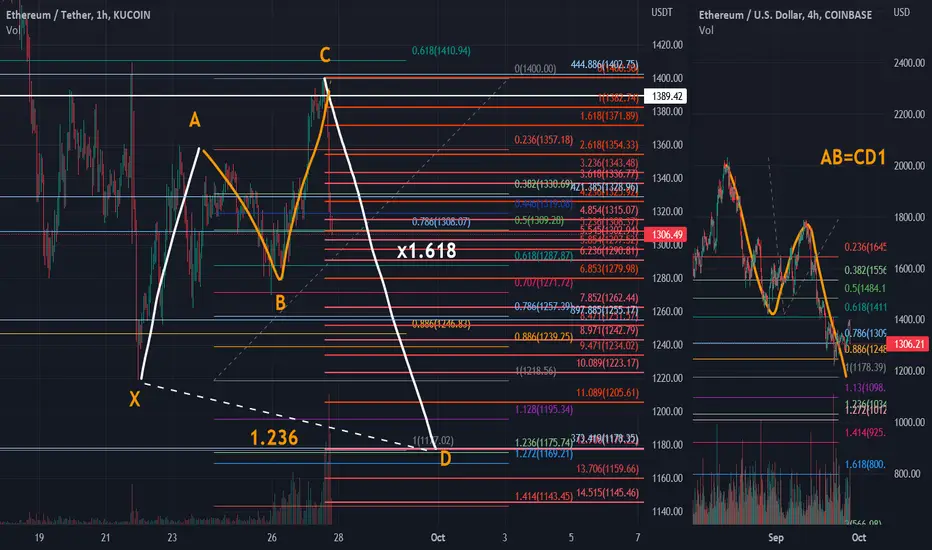
ETH 1178CD=XA x 1.618
Parabolic Impulse down Fib 12.706
Fib-from-Birth 373.419
XD=1.236
Macro AB=CD1
So much confirmation!!
NIFTY 50, WAVES- REUPDATED!!in my previuos analysis of nifty50 waves(i will mention the link), i had drawn the waves which existed with the 2 major black line(drawn out in chart), i had thought nifty 50 will complete its 5 wave bull run impulsve movement, in that trend itself. but due to the affect of US markets, nifty is fluctuating(same acts for NIFTYIT too), so it will now hold that support(drawn in black line), which is drawn from the markets getting consolidating, after the 2020's bull run. and end up in same trend line which was going previously.
today(23rd sept), when the markets opened which gave a breakdown to my analysis, i had drawn out the purple line, and today the same days when markets got closed, supporting my line, i am confirmed now with my waves.
therefore this analysis even says that US markets will also recover very soon, and will give its bull run.

GBPUSD Correction Phase Expected After The Bearish Impulse MoveGBPUSD has been trading in a bearish trend for a long time now and its safe to say as we broke the 1.14010 low. But on the 4 hour timeframe we saw a complete clear impulse move which all guidelines are not violated so we can possible expect a correction to the upside in this case I wouldn't suggest an impulse move up as we realise overall we are in a strong downtrend by simply looking at market structure every time we saw a bit of pullback it didn't last it was followed by a strong bearish move this move is not any exception.
Well it can be any corrective move but we can at least expect a zig-zag as its very common. The idea is long term we are still bearish but we can take advantage of short term pullback moves.

GLAND PHARMA, RSI DIVERGENCE!!the stock will have a good impulse move, it has corrected a lot, one can earn about 90% from taking a swing trade. the stock has reached at a price of its IPO's time only.
good RSI DIVERGENCE is forming.
stock price targets are too mentioned.
at last: have a look on moving averages too.
