GBTC Is Looking For A Bullish Resumption After Bitcoin HalvingWe talked about bullish GrayScale Bitcoin Investment Trust (GBTC) already back on February 28th with a weekly free chart, where we mentioned and highlighted an ongoing five-wave impulsive bullish cycle.
Well, as we actually expected, after GBTC reached all-time highs, we can see a projected slow down that looks like a wave (4) correction.
A correction actually occurred a month before the Bitcoin halving and finished right before the Bitcoin halving. And, as you can see now in a closer, 4-hour chart after the halving, GBTC is bouncing from projected support after a completed A-B-C correction in wave (4), so wave (5) is now in progress, which can easily lift Bitcoin price back to highs as well.
Impulse

INJ - Injecting An Impulse 💉Hello TradingView Family / Fellow Traders. This is Richard, also known as theSignalyst.
📈 INJ has been overall bullish , trading within the flat wedge pattern in red.
Currently, INJ is in a correction phase, approaching the lower bound of the wedge.
Moreover, it is retesting a strong support at $31.5.
🏹 Thus, the highlighted blue circle is a strong area to look for buy setups as it is the intersection of the blue support and lower red trendline.
📚 As per my trading style:
As #INJ approaches the blue circle zone, I will be looking for bullish reversal setups (like a double bottom pattern, trendline break , and so on...)
📚 Always follow your trading plan regarding entry, risk management, and trade management.
Good luck!
All Strategies Are Good; If Managed Properly!
~Rich

Solana On The Way Towards All-Time Highs?Solana with ticker SOLUSD remains nicely bullish as expected from technical point of view and from Elliott wave perspective. Looks like it's still trading in an extended wave »v« of 3 with room for more gains, maybe even straight back to all-time highs. Currently we are tracking a lower degree consolidation within a bullish triangle pattern for subwave iv that can send the price higher for wave v of (iii).

Exxon Mobil Is On The Way HigherExxon Mobil with ticker XOM is back in the uptrend after a completed (A)-(B)-(C) irregular flat correction for wave 4. It's in strong rally away from projected support for wave 4, so wave 5 can be now in progress, which should be completed by a five-wave cycle of the lower degree. It can easily send the price towards all-time highs, just be aware of subwave (4) pullback. At the same time Crude oil could be headed to 85-90, maybe even 100 area.

GBPJPY May Face Resistance SoonGBPJPY is in a strong bullish phase, but looking at the daily chart, we can see pair trading at new highs for the final wave 5 of (5) of 3 that can target 193-195 area. Based on the current Elliott wave cycle from 2023 lows, we still think that pair will come lower this year, for a higher degree wave 4 correction.

Silver Is Bouncing From The Support; Bullish Breakout Soon?We talked about silver (XAGUSD) in January, where we mentioned and highlighted strong support at the lower side of a triangle range. On January 26rd we shared a weekly chart of silver, where we warned about limited weakness and sideways contracting triangle range.
As you can see today, silver bounced from the lower triangle line and it’s back to the upper side of a triangle range, which can be signal for a completed A-B-C-D-E bullish triangle pattern, but bullish confirmation and real bullish breakout is only above 26 region.
So far we can see some nice recovery with an important move above 23.50 followed by push out of a base channel and above 24.50 on 4h time frame, which possibly that's wave (3) of 3 within an impulse, meaning more upside can be coming on silver as this one can be preparing on some major breakout of a big triangle, just be aware of short-term pullbacks.

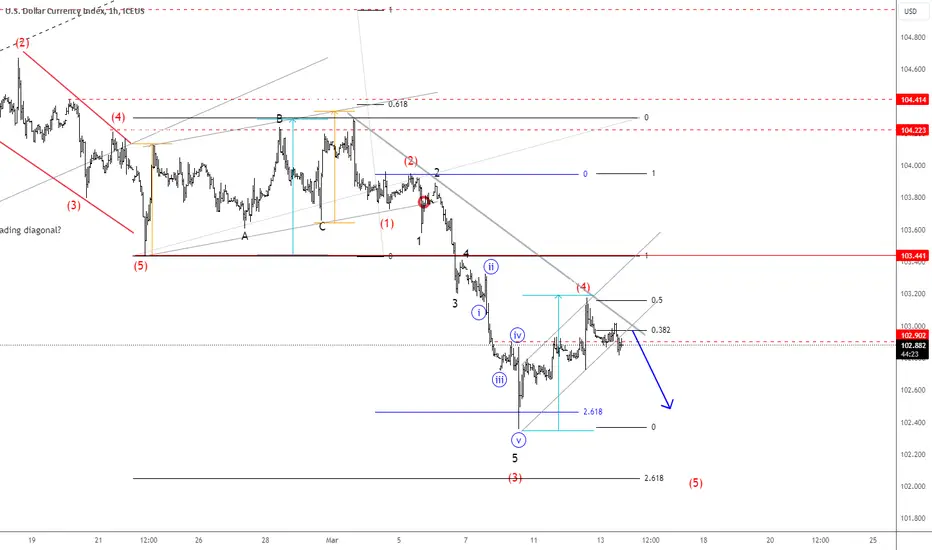
DXY Is Ready To Resume Lower: Elliott Wave Intraday AnalysisUSDollar Index - DXY is falling due to lower US Yields and we have been talking about that in the previous articles. There can be actually room for much more weakness, but on the intraday basis, we see room at least for one more leg down towards 102.00 level or lower.
We have seen some intraday recovery recently, but looks like a clear corrective movement in wave (4) from Elliott wave perspective, which can now send the DXY lower for wave (5).
TSLA - Are you Ready for the Ride?🚘Hello TradingView Family / Fellow Traders. This is Richard, also known as theSignalyst.
📈 TSLA has been overall bearish , trading within the falling channel in blue.
However, TSLA is currently approaching the lower bound of the channel acting as a non-horizontal support.
Moreover , it is retesting a strong demand zone at 150 - 165 marked in green.
🏹 Thus, the highlighted blue circle is a strong area to look for buy setups as it is the intersection of the green demand and lower blue trendline.
📚 As per my trading style:
As #TSLA is around the blue circle zone, I will be looking for bullish reversal setups (like a double bottom pattern, trendline break , and so on...)
📚 Always follow your trading plan regarding entry, risk management, and trade management.
Good luck!
All Strategies Are Good; If Managed Properly!
~Rich

Bitcoin Dominance Is Still HereDespite the fact that Bitcoin is breaking all-time highs and that some ALTcoins are already on the rise, Bitcoin dominance is actually still here and there can be space for more upside to complete a five-wave bullish impulse before Bitcoin dominance slows down and ALTcoin dominance kicks in. From Elliott wave perspective, we are tracking a bullish triangle in wave 4 that can push Bitcoin dominance towards 57% - 60% for wave 5.

MATIC 44-61$Now the price is in the asset redistribution zone of 0.4238-2.1520
The price of the volume of this redistribution is 0.8450
The price of the total volume is 0.0218
There are already 3697 between them%
Expected growth 44.7959-61.4676
From the current value, another 3,600%

Cardano Can Retest December 2023 HighsCardano with ticker ADAUSD can be trading in a higher degree wave (5) that can retest the December 2023 highs.
Looking at the short-term hourly chart, we see it slowing down for subwave iv correction before a continuation higher for wave v of (5) towards 0.70 - 1.00 target area. Ideal support comes here around base channel resistance line and 0.58 - 0.56 area.

BITCOIN KEY LEVELS!There is a very nice range shown on the BTC chart!
I mapped out these levels to make it easier for you to see where the LONG opportunities and SHORT opportunities are.
Let me know your thought sin the comments below
Calculate Your Risk/Reward so you don't lose more than 1% of your account per trade.
Every day the charts provide new information. You have to adjust or get REKT.
Love it or hate it, hit that thumbs up and share your thoughts below!
This is not financial advice. This is for educational purposes only.

Crypto Market Slowed Down Within Wave 4 CorrectionGood morning Crypto traders! Crypto market slowed down yesterday with an interesting spike down into important support area for a higher degree wave 4, from where we can see a quick stabilization. Well, we believe that more upside is coming for wave 5 of (3), just be aware of more complex wave 4 here if the market stay slow and sideways for a longer period of time.

YNDX Who knew?The distribution in the range 87.11-74.93 marked the beginning of the movement!
Refueling in the control zone 55.45-47.70 confirmed the continuation of movement.
+ in this zone, I set new levels on the distribution, in the range of 53.81-44.02.
Subsequent control zones Global 35.83-26.92 and local 29.46-24.10 were breached with a squish!
Sales stopped in the Global Area of Interest 18.42-11.16
Local area of interest 16.46-11.24
The purchase level of 14.59 is the result
The price of the total volume is 32.08
Results:
1) The initial distribution of the asset 87.11-74.93 shows us the end point 15.77!
2) Refueling in control zones 55.45-47.70 corrects the end point 14.59!
3) The black Swan does not play a special role on the end point! He can only speed up or slow down the course of events!
I personally associate this process with a car!
HOW MUCH FUEL YOU FILL IN THE TANK, THAT'S HOW MUCH IT WILL LAST
!!! MATH AND NO MAGIC !!!

GBPUSD I Short-term buy from support after recent impulseWelcome back! Let me know your thoughts in the comments!
** GBPUSD Analysis - Listen to video!
We recommend that you keep this pair on your watchlist and enter when the entry criteria of your strategy is met.
Please support this idea with a LIKE and COMMENT if you find it useful and Click "Follow" on our profile if you'd like these trade ideas delivered straight to your email in the future.
Thanks for your continued support!

NASDAQ100 Slows Down For An Intraday CorrectionNasdaq100 is in strong bullish trend and there can be room for more upside within a projected intraday five-wave bullish cycle. Nasdaq100 futures recently slide as Alphabet shares drop on disappointing Google ad revenue. However, that's pretty nice textbook 17300 - 17200 support area within an (a)-(b)-(c) correction for wave "iv", so ahead of today's FED meeting, be aware of a bullish continuation for wave "v". Invalidation level is at 17050.

GBPUSD Points Higher After A ConsolidationCable has seen some nice recovery at the end of 2023; move that is looking impulsive so more gains can be seen after the corrective retracement that is now underway. Ideally, that's wave four correction, a higher degree pullback that can sooner or later send prices back to the highs, possibly already now after first support for a triangle near 1.26 held, but we still need broken upper triangle line near 1.2750 to make sure that fifth wave up is in play for 1.29-1.3 Deeper support is at 1.25 if 1.26 flor is broken.

What Color Is Your Tesla 🚘Hello TradingView Family / Fellow Traders,
On Weekly: Left Chart
TSLA has been hovering inside a range between the $200 support and $300 resistance.
Lately, TSLA has been bearish trading inside the falling blue channel and it is currently approaching the lower bound and $200.0 support.
🏹 Hence , as long as the 185.0 support holds, we will be looking for buy setups on lower timeframes.
On H1: Right Chart
📈 For the bulls to take over, we need a momentum candle close above the last major high in gray at 218.0
📉 Meanwhile , TSLA would be bearish and can still trade lower to dive inside the 185-200 support zone before trading higher.
📚 Always follow your trading plan regarding entry, risk management, and trade management.
Good luck!
All Strategies Are Good; If Managed Properly!
~Richard Nasr

HelenP. I After correction, Euro can come back to $1.1000 levelHi folks today I'm prepared for you Euro analytics. If we look at the chart, we can see how the price some days ago rebounded from the trend line and rose to the 1.0740 support level, which coincided with the support zone, but at once bounced and made correction back to this line. Later price rebounded from the trend line again and finally broke the 1.0740 level and even rose to the 1.1000 resistance level, which coincided with the resistance zone and tried to break it, but failed and in a short time declined to support level, breaking the trend line. Then Euro bounced from this level and made a strong impulse up to 1.1135 points, thereby breaking the trend line and resistance level one more time. But the price cannot fixed and soon declined lower than the 1.1000 level with the trend line, breaking their again. Next, EUR rose to a resistance level, and a not long time ago it rebounded down. For this moment, I expect that the Euro will come back to the 1.1000 resistance level, therefore I set my target at this level. If you like my analytics you may support me with your like/comment ❤️

ASTR-2024A promising parachain in the DOT ecosystem
The price came to an imbalance zone of 0.13-0.22
The next zone is 0.56-1.42
The growth potential is 7-9 $
The price of the total volume is 0.0427
The purchase price of 0.035
At the level of 0.14 closed 50% of the pose (body removal)
The rest went into a long-term portfolio!

HelenP. I After strong impulse up, Ethereum can start to declineHi folks today I'm prepared for you Ethereum analytics. A not long time ago price started to trades in consolidation, where it at once declined to the support zone, which coincided with support 2. After this, ETH rebounded from this zone and tried to rise more, but failed and fell back to this zone. Price some time traded in this zone and later ETH bounced from this zone again and rose to 2340 points. Then price made a correction to the top part of the support zone and then rebounded up to support 1, which coincided with one more support zone. After this price made little correction, rose back to this level and at once declined to support 2. Later price bounced from this level and soon made a strong impulse up to 2670 points, thereby breaking support 1 and exiting from consolidation. Now, I expect that Ethereum will make a correction, after a strong impulse up. For this case, I set my target at the 2530 level. If you like my analytics you may support me with your like/comment ❤️

After strong upward movement, BTC can correct to support levelHello traders, I want share with you my opinion about Bitcoin. By observing the chart, we can see that the price a not long time ago started to trades in an upward channel, where it at once rebounded from the resistance line and declined to the support line, breaking the 43200 support level, which coincided with the support zone. After this, the price tried to rise to the support zone, but failed and soon it bounced from this zone and declined back to the support line of the channel. Next, BTC repeated movement up, and this time, the price broke the support level. But later price in a short time declined to support line of the channel, after which BTC made impulse up to the 45700 resistance level, which coincided with the resistance line of the channel and seller zone. Then price declined back to the support line and soon made a strong upward impulse to 48000 points, thereby exiting from the channel and breaking the resistance level. After this movement, BTC recently started to decline and at the moment it trades below the 45700 level. So, possibly Bitcoin can continue to decline to support level. Therefore I set my target at the 43200 support level, and then we'll see where BTC continues to move. Please share this idea with your friends and click Boost 🚀

DASH Purchase!!!DASH has reached the global bottom!!!Purchase zone 18.17-30.23
Purchase level 25.04
The price of the total volume is 77.99
Volume price 27.51
