TON-2024Ton is in the FIRST global redistribution in the form of a triangle!
The price of the total volume is 2.281
Everything below is acceptable for purchase for a couple of cycles and more than 5-10 years!!!
I expect an exit at the end of this month!
The first control zone is 5.646-11.140
Level 7.931
Next zone 40.526-147.418
District 69.801-85.589
Impulse

ARB-2024The global alignment for 2024!
The price goes to the Control ZONE 3.02-4.79
Level 3.81
Correction in this zone (FLAT) or a rollback to the level of 1.91
Further hike to the level of 16.61-19.07
In the global sales area 11.49-27.55
BEAR to the 4.25-1.57 zone!!!
The price of the total volume is 1.1673!!!

DFCGlobal purchase zone 0.1245-0.0670
The level is 0.1024
Locally, it wants to be above 0.155-0.0914
The level is 0.1148
The price of the total volume is 0.2195
Sellers do not put pressure on the market, distribution is proceeding cautiously!

SELL OPPORTUNITY ON AUDUSD On AUDUSD Price is currently trading within a well-defined ascending channel on 1HTF, inside a 4HTF ascending (reversal pattern) this gives an additional confluence.
Waiting for price to test the upper dynamic trendline that serves as my support before going short.
If you found this helpful, please support your fellow trader with a like.

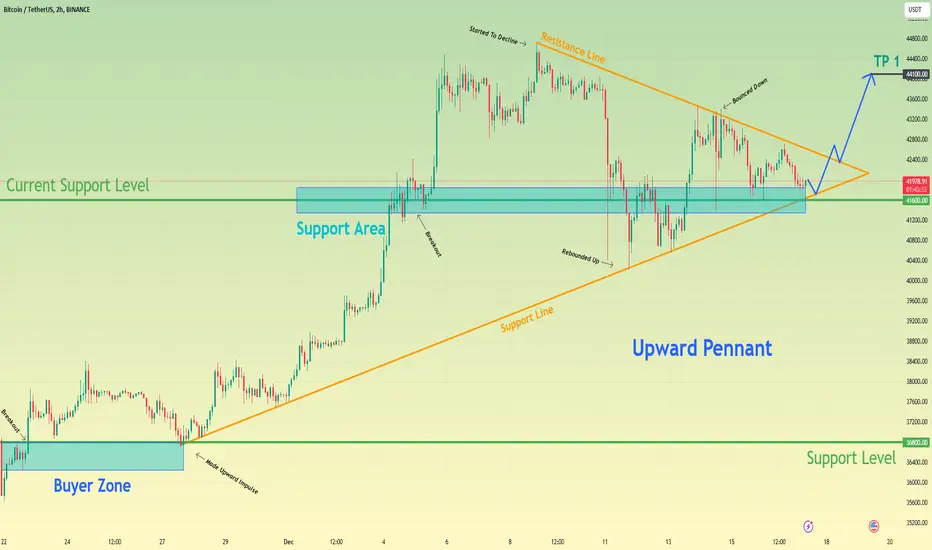
Bitcoin can correct to support line and then make upward impulseHello traders, I want share with you my opinion about Bitcoin. Observing the chart, we can see that the price some time ago reached the 36800 support level, which coincided with the buyer zone and in a short time broke it. Then BTC rose a little more, but soon it made a correction back, after which it entered to upward pennant. In pennant, the price at once rebounded from the support line and made a strong impulse up to the current support level, which is located in the support area. Later BTC broke this level too and continued to move up to the resistance line of the pennant. After it reached this line, the price around down and in a short time declined to the support line, breaking the 41600 level, but a not long time ago it backed up. As well recently, Bitcoin reached the resistance line of a pennant, after which it rebounded to the support area. And now BTC continues to trades near this area and in my mind Bitcoin can correct to support line of pennant and then make an upward impulse, thereby exiting from this pattern. For this case, I set up my target at the 44100 level. Please share this idea with your friends and click Boost 🚀
Cable Is Rising Within A Five-Wave ImpulseCable (GBPUSD) made a nice bounce, with price coming to a new high as BoE turned out to be more hawkish than expected if we consider the votes for the hike by BoE members. So it appears that the pound will stay in the uptrend as the whole pattern from an October low now shows an impulsive price action in progress. Ideally, that's wave five of 3 in progress with some short-term resistance around 1.2850.

UWGN is in the Global Purchase Zone!!!The price has arrived and is in the Global Purchase ZONE of 37.0-18.8
Global purchase level 27.9
Left the local area 24.8-13.6
Local purchase level 20.5
The purchase level according to the backup scheme is 22.3
The volume price is 25.9 !!!
All levels have worked out !!!

BTC is in an Imbalance Zone!!!Bitcoin has entered the Global Zone of Control (imbalance) 42690-59175
Local area 45070-54547
Level 1) 49038
2) 49320
Purchase Levels 15652.1
15732.0
Volume price 19199.2

FLOW has left the zone!!!The price formed a triangle in the control zone of 0.607-0.704,
and after the breakdown left the GLOBAL ACCUMULATION ZONE!
The Next Control Zone Is 0.931-1.233
My Control zones, some traders call them imbalance zones!!!

Elliott Waves Suggests USDMXN Can Be A Nice ShortHey folks,
In this article, I’ll give you an update on USDMXN, which we’ve talked about before. You probably noticed that the Mexican Peso (MXN) has been quite strong for the past couple of years, mainly because of higher interest rates compared to other places, USDMXN short was a good carry trade.
However, things have started to shift a bit recently. Inflation in the US went up a bit due to rising energy costs, and some folks thought the Federal Reserve (FED) might keep a tough stance (hawkish) on monetary policy. This pushed the US Dollar higher along with yields.
But now, there’s a new element in the mix – the geopolitical tension between Hamas and Israel. This situation can make the markets super jumpy and volatile. I’m not so sure if the FED can keep its hawkish stance in such a shaky environment. Keep in mind, during a conflict or war, a government might ease up on its tough policies to fund the war effort and get cheap financing.
So, I’m wondering if it might be the right time to expect USDMXN to continue its downward trend. In fact, the pair has dropped this week, especially after markets opened with some gaps in various assets.
From an Elliott Wave point of view, we can see a decent corrective rise from recent lows, a clear fourth wave move up to the 38.2% Fibonacci resistance. We’re seeing a turnaround from there, and if we break key rising trendline, more bears could join the party. This makes sense since the overall trend is still bearish as long as the price stays below the 2022 trendline resistance. So, I think a fifth wave down might be just around the corner, and it could happen quite quickly, especially if the US Dollar’s trend changes, which is possible if stocks would stay in risk-on mode till end of the week.

Broken Trendline Keeps USDMXN In Downtrend For Wave 5Broken Trendline Keeps USDMXN In Downtrend For Wave 5 from technical point of view and by Elliott wave theory.
USDMXN shorts are doing very well as we mentioned and highlighted on October 12, when we spotted a corrective recovery in wave (4).
As you can see today, USDMXN turned nicely down from projected resistance and it can be headed much lower as bulls failed to break above the daily trendline resistance in October. So this was seen as a corrective and temporary bounce; wave (4), which puts wave (5) in action after broken trendline support, so weakness is ready to resume, ideally down to 16.00.

It is time to SKALE ⤴️Hello TradingView Family / Fellow Traders,
📉 After a 130% surge , BITRUE:SKLUSDT has entered a correction phase and is currently trading within the descending blue channel.
🏹 SKL is presently approaching a robust demand zone highlighted in green. Therefore, as the price approaches this zone, we will be seeking trend-following buy setups on lower timeframes.
📈 For the bulls to assume control and initiate the next upward impulse movement, a breakout above the blue channel is required.
Meanwhile, an expected movement towards the demand zone is anticipated.
📚 Always follow your trading plan regarding entry, risk management, and trade management.
Good luck!
All Strategies Are Good; If Managed Properly!
~Richard Nasr

TRX is coming to unload!!!The redistribution of the coin occurred in the Control ZONE 0.0458-0.0870
The average volume price is 0.656
We are going to unload in the ZONE 0.293-0.989
To the level of 0.489

BNB is in the purchase zone!!!The price has again descended to the purchase zone 224.1-186.2
The price is below the volume price 242.5 The
price is in the global accumulation zone 267.7-199.2
With a high probability, this is a re-test of the purchase zone and the Local zone.
Follow the news around Binance!!!

GOLD - Higher Timeframe Overview ✨This may be against the trend or as my friend says "going against a tsunami" but there's technical evidence to suggest that we may see a drop in Gold for the next couple of months.
On the monthly timeframe we appear to be in wave 3 - which is made out of 5 impulsive subwaves. See below:
Wave 2 and Wave 4 are ABC corrective waves and on the weekly timeframe we can see that we are still within the ABC corrective parameters of wave 4 and awaiting the final C wave, which is a move down. We have the FED rate decision on March 16th which could really shake the market. We're expecting USD strength during FED and Gold is weighted against the USD and is inversely correlated. If USD goes up, GOLD should go down... eventually.
It is important that we do NOT jump in to shorting Gold early without seeing either of the following:
- Lack of buyers
- Any sellers
At the moment there are plenty of buyers of Gold due to the war in Ukraine - Gold is acting as a safe haven. Also, there does not seem to be any sellers entering the market... yet.
The key event to watch is the FED rate decision on March 16th. We could potentially see the start of the bearish wave C during the event. Once we see the first move down, we can prepare ourselves for an entry once we see a correction. See below:
It's better to wait for confirmation rather than try and call the tops and bottoms of a move. Plenty of money to be made after seeing the confirmation and it's less likely you'll be riding out drawdown.
Would love to hear your thoughts - leave your comments below.
Goodluck and as always, trade safe!

ACA in the Global Buy ZONEThe price is in the Global Buy zone 0.0732-0.0226
Local purchase zone 0.0457-0.0230
The purchase level is 0.0363
The way out of the triangle is Vague!!! Is it possible to return to the Local ZONE ???
The price of the total volume is 0.0491
Potential for the future-$43
The DOT ecosystem is developing!

Flow in the accumulation zone!!!The price is still in the Global accumulation zone, as soon as it leaves it beyond the level of 0.703 with consolidation, this will mean the beginning of global growth of the asset!!!
The purchase levels under the "Impulse" strategy were:
Global 0.413
Local 0.410
Buy zone 0.497-0.348, level 0.416
I don't see the strength yet! it is possible to return to the zones: Local 0.560-0.311 and Purchases 0.497-0.348!
The price of the total volume is 0.445 - for those who do not remember, or do not know!
This is the average price of the largest traded volume, and since the price is at the bottom, it is (the average price of the accumulated position at the moment)
Good hunting to all!!!

1INCHUSDT.P 1H long trade at resistance5M chart allowed to enter early
Aggressive trend trade 8R
- short impulse
+ resistance level
+ biggest level T1
+ biggest level 2Sp-
+ weak test
+ below first bullish bar closed entry
Calculated affordable stop
1 to take profit (can extend to 1 to 2 of 1H if closes volumed Sp)
1H chart situation
+ long balance
+ resistance level
- expanding ICE level
1D chart context
+ long impulse
+ significant bar level

BTC/USD: Bull Market Confirmed! Here's What's NextAfter careful analysis, it's clear we've entered a bull market for BTC.
The global correction wave 4 concluded in November 2022, and the recent price actions offer confirmation. Here are the key takeaways:
The trend from 23rd November 2022 presents as a robust bullish impulse.
All impulse waves and corrections looks nice and well-balanced.
The waves within this trend are well-proportioned and align with various Fibonacci levels.
It's almost too good to be true!
We're currently riding wave 5 of the initial bullish impulse. Expect bullish momentum to persist until the end of November. Following that, prepare for a retracement back to the ~$25000 region before we launch into a massive bull run for 2024!

BTC KEY LOCAL AREAS MAPPED!Bitcoin is currently trading below a local SFP level and is looking to cool off a little bit over the weekend, possible coming back down to the golden pocket mapped out below (Orange Double Lines). If it does reach that zone, I would expect price to keep climbing in the short term, but anything can happen.
Lets see how this all plays out.
This is a great area to long BITCOIN using the right risk management.
Calculate Your Risk/Reward so you don't lose more than 1% of your account per trade.
Every day the charts provide new information. You have to adjust or get REKT.
Love it or hate it, hit that thumbs up and share your thoughts below!
This is not financial advice. This is for educational purposes only.

ICP purchase !!!The asset has again entered the buying zone 3.648-2.625
Touched the purchase level of the local zone 2.910
It is below the global purchase level of 3.624
It is below the volume price of 4.229
My pending order 2.910 was triggered
Stop order 2.09

GBPUSD FOrecastWe're in a bearish impulse pattern. Waves 1 and 4 not overlapping. The wave 4 touched the 38,2 Fibonacci retracement level.

USDJPY ForecastWe're approaching a corrective phase. Price has completed the impulse sequence with waves 1 and 5 equal potential sell-off.
