Impulsewave


LinkUsdt In 4th wave of Downward Impulse WaveLinkUsdt is currently in the 4th wave of an impulse (downtrend). This 4th wave is not expected to go more than 50% of wave 3. So i would not expect this 4th wave retracement to hit $2.80 and above.
I would expect Link to hit at least $1.50 when it goes into the 5th wave.

4H stochastic analysis + full 5 wave count of Elliott WaveI made this chart to show the example of using stochastic to help determine the wave
Of Course, this is not perfect...
1. need to use fib
2. trend line needed (black arrow)
3. the knowledge of high volatility , when fib exceed 168%
4. the case when gold retrace too small (like 0.27 retracement instead of 0.382)
5. when the fractal (small time frame movement really weird and does not add up)
6. THATS WHY MINIMUM 1 H TIME FRAME NEEDED
7. DON'T USE THIS TECHNIQUE ON 5 minutes and 15 minutes time frame, gold like to SL hunt at those timeframe

WYXYZ Path To 8600 LongLooking like it might make a choppy WYXYZ path to the 2 point at 8600 using symmetry. If I'm feeling adventurous I might scalp the final X point short tonight but only with very small size and very small risk since on virtually all time frames except that I am highly bullish.
Mainly I'm looking for the Z point which is also the 2 point. I might leave a limit order to buy that overnight although I usually don't like to do that and want to be there in person to execute the trade.
I'll probably get up early tomorrow to see if there's a valid entry long signal on this.

Dissecting XRP through Elliot Wave TheoryThe major corrective movement ends the major wave (2) as the price reached 0.17 dollar in mid December. Now the price is entering major impulsive wave (3).
Here comes the dissection...
Wave (3) consists of (i)-(ii)-(iii)-(iv)-(v). As you can see from the chart, wave (i) is finished, we now expecting wave (ii) to play as a corrective move from impulsive (i). I highly expect that wave (ii) to be zigzag because the A wave turns out to be 5-waves impulse.
Now we are in B wave, I expect the price to retrace back to the yellow box more or less before continue to drop finishing wave c in lower box.
This Analysis is just 1 of many possible scenarios, but I quite confident about this.
Cheerss

NIO- You may have missed Tesla's run, but you still have NIO!Ready to buy on the dip?
NIO suffers from the same issues that Tesla has... Production capacity and profitability... But it benefits from the same hype- EV is an emerging and environment-friendly trend. Furthermore, China is the biggest EV market and only 2% of the market is tapped.
Tesla may have the first mover advantage, but NIO enjoys the recognition of the homegrown brand in China.
Let's take a look at the technical analysis.
Impulsive wave cycle has recently run its course and, I believe the distribution is currently underway.
The price is stalling at Fib 61.8% and POC, Kijun and bollinger midlane are providing the temporary support on the daily timeframe that I suspect will only hold for so long.
The reason being that the volume has been on a sharp decline as the price went up and, the potential ascending H&S is looming on the horizon.
Based on the confluence of Ichi, multiple fib lvls, swing highs/low and VPVR, I believe $2.50-$3.15 is the buy zone we should watch out for.
This is not the financial advice so please do your own research before you dive into NIO as it has been acting quite volatile lately.
Please click like if you enjoy my analysis :)

4H NZDUSD Elliott Wave CountLet's count waves.
Do you see the same potential upside for this pair?
I am a beginner in Elliott Wave Analysis and this is my sentiment.
The minor impulsive wave in RED has been completed and corrected via an ABC structure with 5-3-5 sub-waves.
The parallel lines connecting the end of wave B and the end of wave A usually forecast the end of wave C as shown.
Price is currently at a key level marked in the red rectangle which has shown to be resistance and in the past was support level.
Finally, the RSI indicator is currently at 31.20 as I type this and signifies that the price is oversold.
Comments, critiques, and anything else is accepted.

TCS Dec Quarter result, but technically Let Us See the NSE:TCS Dec 2019 Q3 results,
Net profit rose 1 percent sequentially to Rs 8,118 crore in the quarter ended December, Actually met the estimate and Revenue rose 2.3 percent quarter-on-quarter to Rs 39,854 crore—in line with the estimate of Rs 39,836 crore. Operating profit, or earnings before interest and taxes, rose 6.5 percent to Rs 9,974 crore. And TCS have announced interim dividend to the shareholder (Source: Bloombergquint). Even the results are on positive side stock went negative side on today's trading day, as fundamental stock is looking good.
As per technically stock is completed third wave and formed a triangle wave in 4th wave correction, so far stock has to break for levels of 2274 to go long, if market goes on negative side then the targets are around 2000 and below. for long - target arrived through technically is 2800 around if it breaks the all time high. will wait and see what market has for us.
for any queries reach us through writetomonk@gmail.com or "9884344490".
Disclaimer: Stock updates are only for educational purpose.

What I'm seeing on COPPER!Good day Traders! Happy new trading year! Lately from the weekly TF, Copper has broken out of my long-term resistance. To further reinstate my now bullish bias, i looking forward to price retesting this broken resistance which should also tally with my Daily TL support. I'' further be watching H4 for further pattern confirmation. This is what im seeing. Lets see how this goes.
Do well to like, comment and follow.
Remember that proper risk management is crucial.

GBP/USD Shorting Opportunities We are seeing a corrective channel on this pair currently, with ascending price acting quite correctively
I can personally see a small move up before an overall bearish impulse to bottom of channel starting point
Confluence for this setup are as follows:
- ascending channel in the form of a correction
- pattern separation within the larger timeframe structure, hinting at a bearish move to come

Bullish Elliot Wave FormingLooks like an Elliott Wave is forming. The Fib didn't look right using that initial highpoint. But moving down to the next high placed everything where it made sense. I'm pretty sure the price was supposed to drop, but a whale entered the market and shook some things up. Sad. I was hoping to rebuy at 6800.
If wave point #2 should somehow fall below #1, the wave is invalidated.
If wave point #3 fails to rise above #1, the wave is invalidated.
If wave point #4 falls below #1, the wave is invalidated.

ORBEX: DXY Looking Impulsively Bearish After Golden RetracementThe US Index correction up to the 61.80% Fibonacci retracement of minor waves 1-3 missed the 98.66 low of wave 1. This means that the current structure can be still considered impulsive.
With bears pushing prices down sharply, the chances of reaching fresh lows for the completion of minor wave 5 are increasing.
This scenario could be validated below minor 3's low at 97.10. Should that be the case, the index could extend its losses anywhere down between 95.50 and 96.34!
Stavros Tousios
Head of Investment Research
Orbex
This analysis is provided as general market commentary and does not constitute investment advice.


ORBEX:SPX,DXY - Equities Upbeat As Phase-1 Agreed in PrincipleIn today’s #marketinsights video recording, I talk about China's comments on Phase-1 of a potential trade deal with the US and last Friday's #NFP numbers.
I look at the SPX and DXY as both are affected by the above events in a different way; the S&P500 remains upbeat on Friday's sentiment whereas the dollar index, although yields were seen ending the week higher, was a likely is going to remain under pressure on safe-haven outflows.
Stavros Tousios
Head of Investment Research
Orbex
This analysis is provided as general market commentary and does not constitute investment advice

adani power analysisadani power analysis. if it break 70 then it gives big moves... so now waiting for a breakout..

ajantpharma analysisits like move start in the ajantpharma, chart break the 18 months treandline and pull back. after the pullback it take same trendline as a support. now ready for big move..

this is how wave 3 looks likein my opinion we have completed WXY correction that i was talking about for some time. this is wave 3 and my target for end of it is at least 18K. i'll show you why

ORBEX: EURGBP - Ready to Take Break-even Stops Lower?EURGBP could move a tad lower to complete intermediate wave 2 near 0.8480 before continuing higher. The said level is the 100% FE of the first minute degree zig-zag and could be duplicated as minor X was somewhat dominant.
Look for a valid reversal above last zig-zag's minute b wave but expect minute c to complete first. Minute c should be truncated to support this outlook, otherwise, fresh lows can be expected.
Should prices move below minute a low the complex minor W,X,Y pattern could come to an end.
Stavros Tousios
Head of Investment Research
Orbex
This analysis is provided as general market commentary and does not constitute investment advice.

Ethereum's (ETH) price will retrace - Short ($140)Ethereum's (ETH) price tested the Weekly Candle Close in range of ($189 and $196). The Colored zone is playing the role of a strong resistance level that will stop the price growth and forced to retrace in a downward direction to find support to hold on.
Fundamentally last two weeks Ethereum's (ETH) price dropped more than 25% for a short time. BTC had a drop of more than 17%, those kinds of numbers are speaking of a new bearish trend coming. As I said in the last Ethereum's (ETH) prediction a bearish trend is coming. Historically diversification towards smaller assets indicates a future drop. The last few days altcoins had a growth of 10% shortly. To me, this is can be read as a signal for future drop and manipulation for the masses. ETH will retrace one way or another probably making new lows. Negotiations between the USA and China are taking place in those days. If a consensus isn't reached the stock market will drop 6 to 7%. The snowball effect will affect the crypto market as well. This will give more bearish momentum to the situation we are in right now.
In my opinion, there will be no deal between the USA and China at that current moment.
Technically Ethereum finished Five Impulsive Waves, calculated by Elliot Waves Theory on 29 of August. Price retraced more than 35% forming a 2nd wave up to $223. That means by Elliot Waves Theory that most likely we are in 3rd wave. An aggressive drop should take place. Last few days we had a retracment to $194. The retracement formed an ABC corrective movement which is a bearish sign. Ethereum's (ETH) price tested the Weekly Candle Close in range of ($189 and $196). The Colored zone is playing the role of a strong resistance level that will stop the price growth and forced to retrace in a downward direction to find support to hold on. On the other hand, on a 4H time frame, an Over Sold - Relative Strength Index (RSI) can be spotted. It means that the drastic movement has to retrace cause Over Sold condition is a bearish indicator. Ethereum's price is testing a 200-candle exponential moving average (EMA) on a 6H time frame. If the price can't reach above $198 at that moment a retracement is inevitable.
Conclusion
Ethereum's (ETH) price will retrace to find a solid support level. Strong support zones are price levels at $140, $137 and $125.
Good luck!
"If everyone is thinking alike, then somebody isn't thinking."

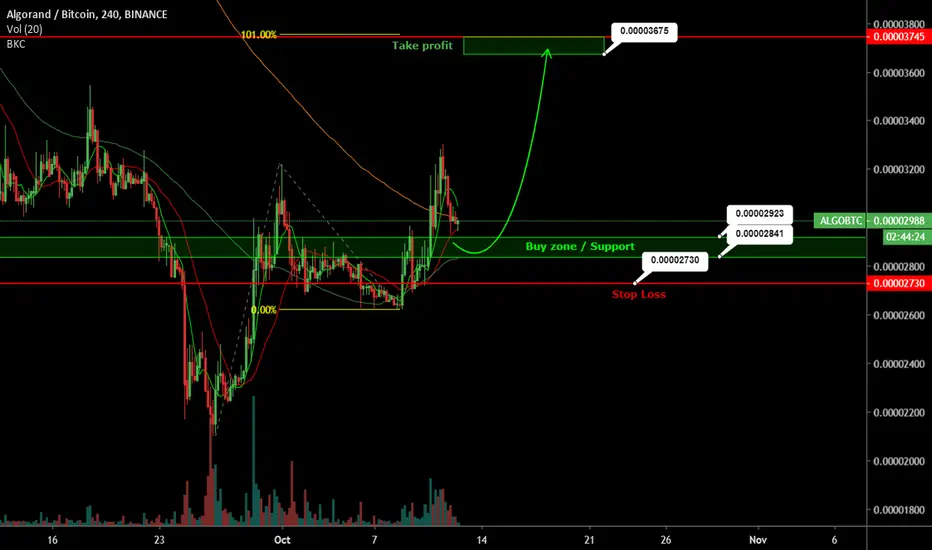
ALGOBTC BullishI like trend of ALGO chart. ALGO is creating Higher Highs and Higher lows and this is great signal for 5. waves impulsive movement ! Now, I´m waiting till ALGO come to our Buy zone. Targets, Stop loss, Buy zone values are in chart. This trade have potential more than +25% ;)