Bullish Breakout - Elliot TheoryI have been watching this stock for months. I started to realize Elliot wave theory was occurring once it did the first 5 waves in Dec 2017. From then on it looks like It did a double three wave followed by an ascending triangle with the E wave overshooting just as Mr Elliot has theorized . However I am not sure at what stage the larger trend is in . I believe that the first 5 waves indicate wave 1 and then the WXY plus the triangle are Wave 2 however , it is said that wave 2 never or rarely ever does a double correction on those corrections only occur in wave B or wave 4 but if correct would indicate the start of Wave 3. If anyone has other interpretations please post.
Impulsewave

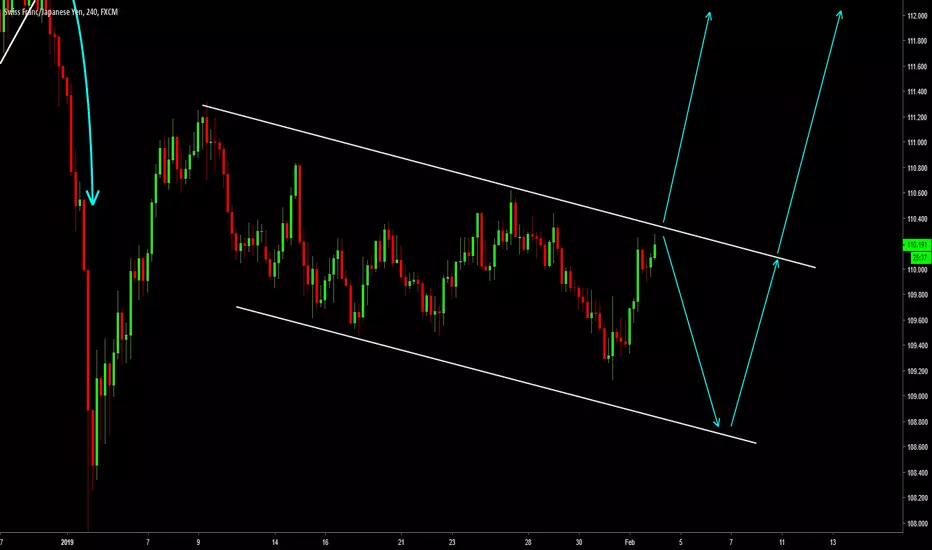
GBP/USD: Swing-Setup! Breakout and your OPPORTUNITYHey tradomaniacs,
welcome to another free signal!
Important: Wait for the retracement down to entry!
-----------------------------
Type: Swingtrade
Buy-Stop: 1.29457
Stop-Loss: 1.28752
Target 1: 1.30
Target 2: 1.305
Targt 3: 1.30985
-----------------------------
LEAVE A LIKE AND A COMMENT - I appreciate every support! =)
Peace and good trades
Irasor

Bullish Counta potential buy opportunity to catch wave C or 3
also note
pink wave B or 2 almost hit the 38.2% retracement level
pink wave B or 2 is an expanded flat, where blue wave {c} = approx 1.618 blue wave {a}

GBPNZD - SHORT - ASCENDING CHANNEL + H&SI see a short opportunity with GBPNZD as there is a pattern within a pattern.
As you can see the nature of the market is that it is currently on a downtrend and price is correcting.
Both channel and head and shoulder pattern have tendencies to break towards the downside which will help us determine the next impulse.

EW ANALYSIS: EURNZD In A Big Three-Wave Corrective RallyHello traders! Today we will talk about EURNZD which has pretty clear pattern.
When using the EW, everyone can count up to five, but only few analysts have the right approach and this experience can only be gained through multi-year practice.
Well, looking at EURNZD, we can clearly see a big impulsive five-wave drop away from 1.7930 highs into a wave A, which means that the trend is currently bearish, but before a bearish continuation, EURNZD must first finish a big three-wave a-b-c corrective rally in wave B that can find resistance ideally around 61,8% Fibonacci retracement and around 1.73 – 1.74 levels!
That said, we believe that wave c/B is still missing, which should be made by five waves, so don't be surprised if EURNZD starts to rise sharply in the next few days/weeks. But, you know where is the limit and till then, there's room for 600-700 pips, so maybe would be nice to catch some longs since we have seen a sharp bounce in the last couple of days that can be the beginning of a five-wave rally for wave c/B!
Remember, the major trend remains bearish as long as the price trading below 1.7930 highs! We are currently just observing a bigger correction which may become even more complex, so any earlier sharp decline back to 1.6330 lows would be an indication that correction could be already completed!
Disclosure: Please be informed that information we provide is NOT a trading recommendation or investment advice. All of our work is for educational purposes only.

EUR/CHF 1DSome view on Eur/Chf possible setup in couple of days of impulse and correction pattern. In wave C I see 3-3-5 formation is heading to complete on 4H chart, and price could possibly going down.

Post-triangle symmetrical impulse Elliott waveMy previous publications highlighted the fact that the 2018 Retracement was a remake of the 2014 Retracement.
The idea was to have a resultant in 2019 similar to that of 2015, starting from the Ultimate Dip of 01/12/2015.
However, with more than 10 strong and concordant indicators, I had identified that the DIP of 12/15/2018 was in all respects similar to 01/12/2015.
Now, we benefit from more than a month of visibility: so, the post-Dip 2015 is it still comparable with this beginning of the year 2019?
Here is precisely reported on 2019, at identical % (logarithmic technique), the symmetrical triangle of 2015 followed by what I identify as an impulse Elliott wave, departure of Bullrun 2016-2017!
Result? If the correction wave followed by points A and B of the triangle coincide with 2014-2015, this is no longer the case of point C of the 2015 triangle!
So be careful: it isn't a predictive plot but a comparison, which will allow us to judge in "live" if the price of Bitcoin in 2019 is close to the waves of 2015 and so to draw interesting conclusions: validation of the end of the bear market by an isosceles triangle smaller than in 2015, or on the contrary dead cat bounce in progress, see horizontal stabilization without volumes of purchase ...
... my outline in blue (Elliott waves) will hopefully see more clearly over the next 6 months on the outcome of the prices.
I will comment of course my deductions regularly below, so don't hesitate to activate the follow-up of my publications!

CHFJPY. Higher From Here? Or Another Move Down Before It Goes?CHFJPY has been moving correctively for some time.
For now ignoring any short plays.
Wanting to catch the next wave up.
Here are two options.
1- Wait for price to aggressively break out from where it is currently and
wait for smaller TF correction before entering.
2- Hold out for another move down and get in after price breaks the lows.
ETHUSD Bullish Outlook. Run Up Expected. Price is setting up nice for the next bullish wave up!
Great RvR on this trade. With BTC technically setting up for a nice
move up it adds a greater level of likelihood for this
one to go favorably as well.
Trade with care my friends :)

break resistanceEURAUD price break the resistance zone with an impulsive candle , and we can see the backtest. Its a nice entry for long position with SL: 1.59, and the target is the next resistance: 1.615

Rally done or just pullback? Maybe bear trap: too soon to short?Caution is in order, this rally has faked us out twice already, looking near pivot, then jumping higher. Bears been expecting a double bottom formation and still are waiting.
On the daily chart Sand P has an Elliott Wave bullish impulse form developing, rather than the ABC many contributors have suggested. The segment labeled (3) is quite a bit longer than the (1). In an ABC countertrend, if these were A & C segments, we'd expect them to be nearly identical in length; these are not, and (3) has both broken above the 0.50 Fibo and exceeded the previous downtrend low price of higher order (1) from October, violating EW principles for an ABC.
If this pans out, we can expect a Fifth rally wave to touch the 0.618 Fibo. Today's price turned back from the TL reaching back to 3 Sep. A lower order TL from Nov suggests a Fifth wave could get to near 2712 price. Any positive news in a market pounded with worrisome tweets will do it. The EOD pivot on 1/22 also implies a bullish undertone.
Market index has closed the gap up from Friday's enthusiastic runup. Was this an exhaustion gap? It may have just a bit left to run, perhaps within 2-3% of the rally top now.
Still too early to short IMHO.
In my other idea on Dow I suggested the TL and Fibo both coincide at price $25040, just a bit over 2% above today's close. Let's see if the bulls can get it up there.
As always, this isn't advice, just another crackpot idea, trade at your own risk; GLTA!
PS I labeled this idea "Neutral" as it is a study of price near a pivot, which may have come, or may still be yet to come soon.

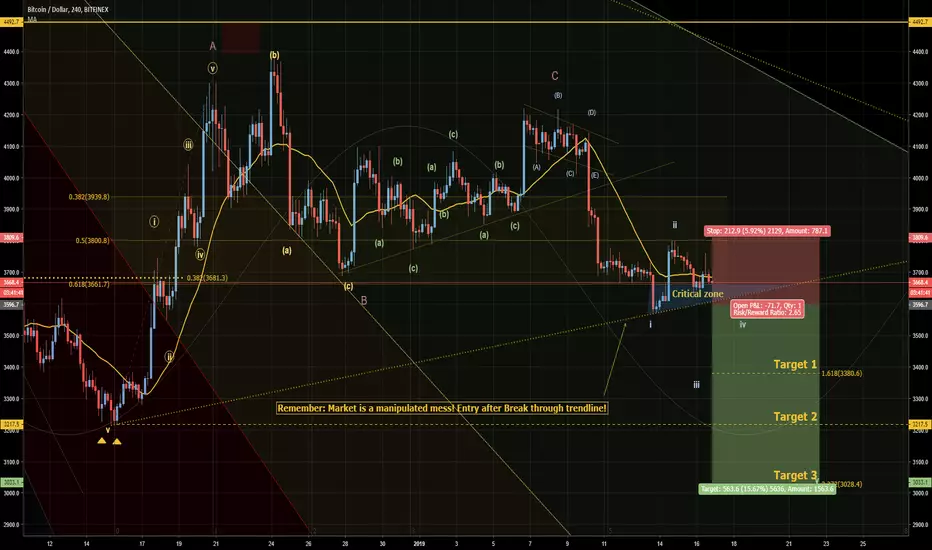
BITCOIN: Swing-Setup! Short down to 3k?'Market is a mess!#ChanceHey tradomaniacs,
welcome to another free signal!
Important: MARKET is a manipulated mess! No liquidity = hard volatility!
Make sure to place a sell-limit after the break through the 61,8% retracement and the trendline!
-----------------------------
Type: Swingtrade
Sell-Limit: 3.596
Stop-Loss: 3.800
Target 1: 3.376
Target 2: 3.217
Targt 3: 3.033
-----------------------------
LEAVE A LIKE AND A COMMENT - I appreciate every support! =)
Peace and good trades
Irasor
Wanna see more? Don`t forget to follow me.
Any questions? PM me. :-)
AURORA CANNABIS INC. (ACB): A Formed Cup & Handle Find Winning Trades In Seconds >> efcindicator.com (Special Discount)
AURORA CANNABIS INC. (ACB): A Formed Cup & Handle Preceding New Impulses Waves? It seems so.

EUR/USD: Swing-Setup! The BREAKOUT back to 1,17?#TEAMBULLHey tradomaniacs,
welcome to another free signal!
Important: Wait for the Breakout of the triggerline or for a Buy-Limit or place a Buy-Stop!
WATCH OUT - Markets are very uncertain and dirven by political events! Don`t risk too much!
-----------------------------
Type: Swingtrade
Buy-Stop: 1,15021
Stop-Loss: 1,142
Target 1: 1,15990
Target-Zone 2: 1,164 - 1,168
Targt 3: 1,170 - 1,173
-----------------------------
LEAVE A LIKE AND A COMMENT - I appreciate every support! =)
Peace and good trades
Irasor
Wanna see more? Don`t forget to follow me.
Any questions? PM me. :-)

Bitcoin Bullish BiasEither it finished a Wave 2 or a Wave B. In the first case, the most likely move is a Wave 3 with 5500 as a target. In the second case the most likely move is a Wave C with 4800 as a target. Of course ther are still other possibilities.

I'm thinking something like thisIf I don't post this, it will happen like this. If I post this, it probably won't happen this way. lol
NEM ($XEM): Triple ZigZag vs. Impulsive Wave-1 with extensionXEM is difficult to predict now.
I can see a few possible movements:
a) Impulsive Wave-1 with Wave-1
extension = I expect retrace to 1600sats zone.
b) Triple ZigZag Correction = retracement
to 1900sats zone
So, I'm going to wait how XEM manages
re-test of 1900sats zone.
Then the next price movements will be more clear.
Generally, I don't expect that XEM will go lower than 1400sats.
If you like my charts, pls. hit that "like" button, follow me or leave your comments.
Thank you!

Gbp Jpy ShortPrevious Day's Momentum is Bearish overall. I continue to think there is a need to push lower to fill a large wick @141.15. With this bias in mind i take a top down view to find clarity. Weekly- Support @ 140.52, Resist @143.00. Bearish overall on this chart. Daily- 141.34 seems to be a significant level for Bullish price interaction to the far left. 1 Hour- Double Top w/ multiple interactions @ 142.80 within the previous day. Yesterday, we also saw a failure to break the 141.50 Price level of short term support. I would like to see GBP JPY retrace to the 142.26/37 levels in an impulse before pushing lower to fill 141.15 level lower. At that point, we are likely to see a reversal in Bearish sentiment.

EUR/JPY 1HR SHORT We have a corrective pattern forming this looks to be a contracting flat however cannot confirm this as of yet so will watch closely for confirmation, with this is mind will be looking for the third wave down to complete a 3 wave pattern using the 1hr 270 fib as a target profit at a price of 126.819..

AUD/JPY 171 PIPS, SELL, 1HR Potential sell opportunity this week, has completed a 5 wave corrective pattern with divergence, will be looking for the next 1hr impulse down with the 270 as target profit. This would give us a complete 3 wave pattern in the 1hr.

USO! when oil starts the bear move it's one of the easiest tradeI've been doing well buying puts once the corrections are developing. Usually about 3-4 weeks out to allow the correction to develop and so I dont get slammed by theta decay. Now eventually if we're in an impulse to go down, we will need to see a bigger correction to develop. Will we get a few more pushes down before that happens, or will it start right now? Either way I'm looking to purchase another put sometime within the next week (as long as we dont breakout past the downtrend line, this will signal a deeper correction/ reversal depending on how price behaves after that)
Longterm view in the comments. (not confirmed yet, just looking that way)US
thanks for looking, and trade responsibly!

Next Bearish Wave Down For ETSY1. Long term EMA (50), which supported the market since March 2018 has been broken. Now acting as resistance with latest reaction at 44.60.
2. Bearish wave structure, 5th Impulsive wave expected.
3. RSI is in bearish channel structure, with space for downside.
Conclusion:
Bearish move in the form of a 5th Impulsive wave expected towards 33.50.

CADJPY Wave Forecast- Could se Zig-Zag pattern form or a Straight move to test previous top, but any how, I leave you with a picture of how to look at The Wave principle.
Plan your trade, trade your plan and trade Safe...
