Impulsewave
GOLD POSSIBLE MOVEHi traders, i am looking a beautiful correction on gold for the next impulse wave.
NOTE : my view or idea is just a technical base not combined with fundamental GOOD LUCK.

GBPNZD Correction from Support and More DownsideWelcome back! Let me know your thoughts in the comments!
**GBPNZD - Listen to video!
We recommend that you keep this pair on your watchlist and enter when the entry criteria of your strategy is met.
Please support this idea with a LIKE and COMMENT if you find it useful and Click "Follow" on our profile if you'd like these trade ideas delivered straight to your email in the future.
Thanks for your continued support!
Brian & Kenya Horton, BK Forex Academy

GBPNZD It will correct upward 100+ PipsWelcome back! Let me know your thoughts in the comments!
**GBPNZD - Listen to video!
We recommend that you keep this pair on your watchlist and enter when the entry criteria of your strategy is met.
Please support this idea with a LIKE and COMMENT if you find it useful and Click "Follow" on our profile if you'd like these trade ideas delivered straight to your email in the future.
Thanks for your continued support!
Brian & Kenya Horton, BK Forex Academy

You missed last wave? Another is coming Get ready for another strong impulse wave.
FIL can double your money soon enough.

Bitcoin - Divergence (Live Example)Divergence:
Warns that the current price trend may be weakening, and in some cases may lead to the price changing direction.
For confirmation the completion of the full 5 Wave Impulse cycle, we look for the 5th Wave to show signs of divergence. This is our first indicator that we might begin to see the ABC correction starting to form.
Price going higher, however the Stochastic RSI going lower.

Resistance | Lower fifth wave | $2000On 4H TF
BINANCE:ETHUSDT is in the impulse wave and it's been the lower fifth wave with target around 2000
After complete, it might be pullback to 1430.
Let's wait and see

Progress a lower impulse wave, $1030On 30m TF
ETH's reaching 1030 to complete an impulse wave with golden ratio 1.382 Fib wave 3.
That downward just begin for higher wave
What next, wait and see

GBPNZD I Trade Plan for THIS WEEK! Welcome back! Here's an analysis of this pair!
**GBPNZD - Listen to video!
We recommend that you keep this pair on your watchlist and enter when the entry criteria of your strategy is met.
Please support this idea with a LIKE and COMMENT if you find it useful and Click "Follow" on our profile if you'd like these trade ideas delivered straight to your email in the future.
Thanks for your continued support!
Brian & Kenya Horton, BK Forex Academy

DXY 3000 PIPS SHORT ANALYSIS We're in wave C of micro wave 4, that is the correction wave of wave 4 which contains three waves (ABC correction waves) based on my previous post. Price gave us an impulse move down to 103.1730 level and corrected. As for now, am anticipating that price will continue its movement to the down side after the wave B completion.
However, price made a correction up to 78.6% fib level from the previous 4H high to the previous 4H low. Therefore, we accept its as one of the confluences that price has reached exhaustion point. For a safe entry, look for break of that red trendline and a pullback, then you can enter. Target will be 101.8320 level, that will be over 3000 pips down. Let's see how the market will play out this week. Stay blessed...

LUNA $100 TARGETJust like the previous SUSHI post, LUNA is on course for a First Wave Extension impulse wave
Target is $97-$121 to complete the third wave, after which a slight retracement to the $54 levels ($38 if volatility is high)
and back up to $150 to complete wave 5.
Expect price to return back to Wave 2 correction in the case of a bear market.
The above statement could result in a larger Wave Degree being formed.

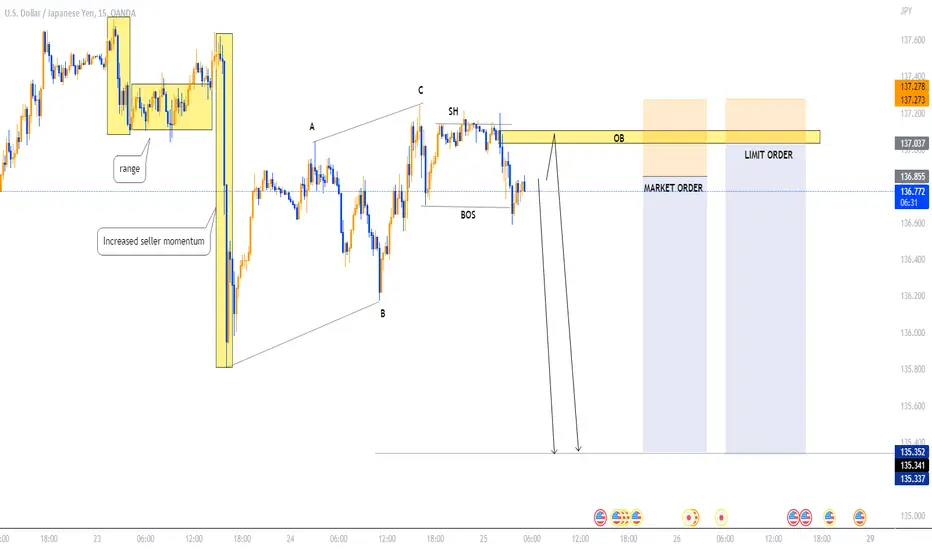
EURJPY | New perspectiveEuro appears to be grinding as we continue to witness the oscillation of price action right above the identified key level at the 137 area.
In this regard, I have identified a demand zone below the key level as a yardstick for a bullish momentum going forward.
Risk Disclaimer:
Margin trading in the foreign exchange market (including commodity trading, CFDs, stocks etc.) has a high risk and is not suitable for all investors. The content of this speculation (including all data) is organized and published by me for the sole purpose of education and assistance in making independent investment decisions. All information herein is for your reference only and I take no responsibility.
You are hereby advised to carefully consider your investment experience, financial situation, investment objective, risk tolerance level, and consult your independent financial adviser as to the suitability of your situation prior to making any investment.
I do not guarantee its accuracy and is not liable for any loss or damage which may result directly or indirectly from such content or the receipt of any instruction or notification therewith.
Past performance is not necessarily indicative of future results.

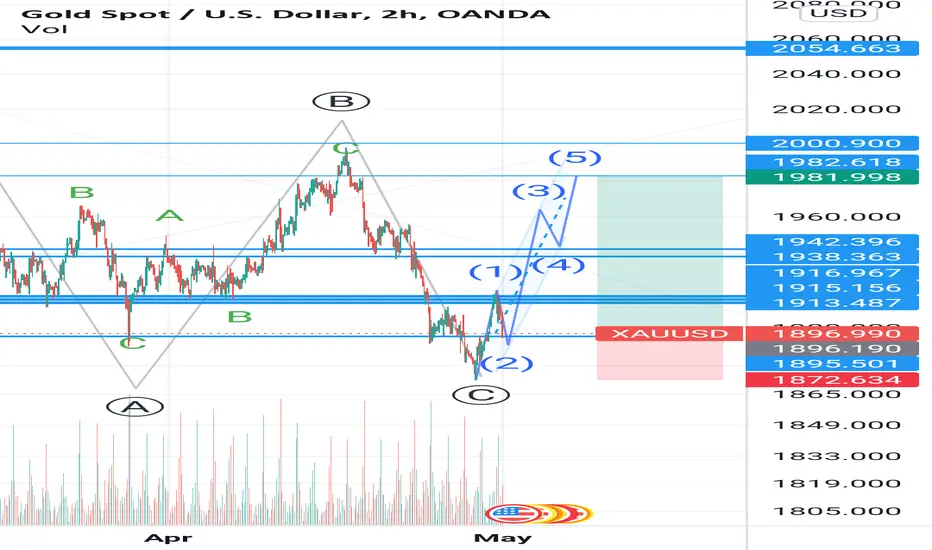
XAUUSD | New perspective Following a sharp decline since mid-April 2022, the Gold prices rallied 1% on Friday on the back of a retreat in the dollar, but the yellow metal was set to end the month lower on bets of aggressive policy tightening by the U.S. Federal Reserve.
In this regard, I am having two possibilities of a counter-trend and trend continuation set-up which are duly explained in detail in this video. However, market open will determine what option we will be leaning on as I shall do an update in the comment section of my tradingview account when confirmations arise.
Risk Disclaimer:
Margin trading in the foreign exchange market (including commodity trading, CFDs, stocks etc.) has a high risk and is not suitable for all investors. The content of this speculation (including all data) is organized and published by me for the sole purpose of education and assistance in making independent investment decisions. All information herein is for your reference only and I take no responsibility.
You are hereby advised to carefully consider your investment experience, financial situation, investment objective, risk tolerance level, and consult your independent financial adviser as to the suitability of your situation prior to making any investment.
I do not guarantee its accuracy and is not liable for any loss or damage which may result directly or indirectly from such content or the receipt of any instruction or notification therewith.
Past performance is not necessarily indicative of future results.

Dax's buy opportunityHi
According my Elliot analysis, we are in starting of third wave for Dax index. This impulse wave can increase to 14730-14950 at the first state.
Have good trade
Yours

Gold's buy opportunityHi
The correction of third wave wss done and forth wave was finished.
We are in impulse increasing wave and a best opportunity to buy.
Have good trade.
Bye
The final wave is coming, huge profitOn daily chart
Loopring has completed four waves at 0.63 after that, LRC's rally.
Right now, the lower impulse wave is progressing. Target is 1.8 in short-term
LRC's high volatility, which suit to trade in lower timeframe.
LRC is still in ascending parallel channel with strong support below 0.63. This range is a good zone to entry for short/medium/long-term.
What next, wait and see.

Double Lower Top Coming?Chart says it better than I can. Moving up from oversold. NFLX put a damper on it but that won't last long imo. Move above 4480 is bullish, eh?
Take a look at Dec 2018 for the pattern. Double top at a lower high after decline from ATH, before the massive selloff.
The projection as shown is for an EW impulse. Might get it, might not. See what we get! No position atm, watchful waiting.

GAS IS UNSTOPPABLE! NATGAS / WEEKLYWe have been forming this structure since the middle of 2021. Impulse finishing soon at 7.xx. You can catch this last wave at intermediate correction that we could expect soon. Around 5.000 would be a good entry.
Goodluck all.


GBPCHF Impulse Correction Continuation Welcome back! Here's an analysis of this pair!
**GBPCHF- Impulse leg on daily and 4 hr. followed by corrective wave/bullish flag. If we get the breakout, our target is 2400 zone (previous resistance).
We recommend that you keep this pair on your watchlist and enter when the entry criteria of your strategy is met.
Please support this idea with a LIKE and COMMENT if you find it useful and Click "Follow" on our profile if you'd like these trade ideas delivered straight to your email in the future.
Thanks for your continued support!
Brian & Kenya Horton, BK Forex Academy

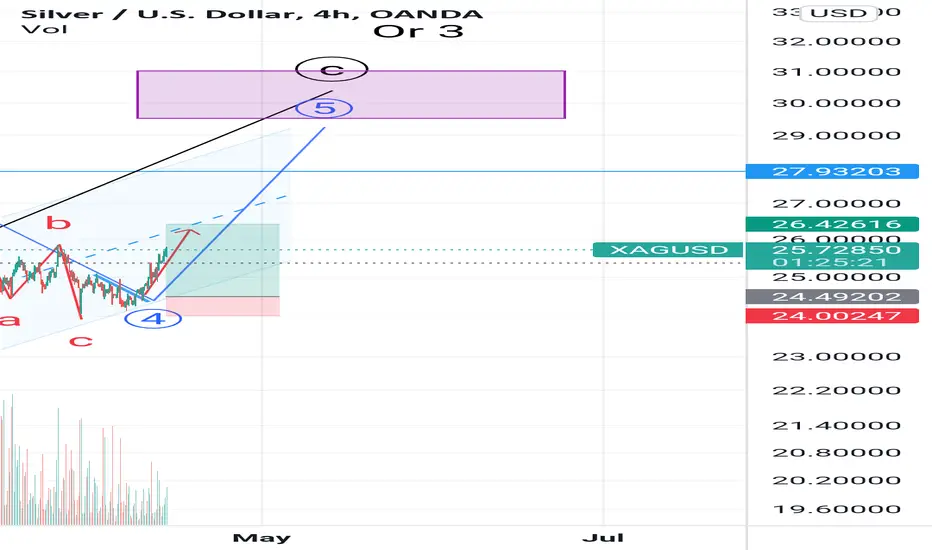
Silver go to 28-30 Hi
In previous analysis, l predict that wave 4 in c (or 3) wave is completed ans told the wave 5 must be started.
Have good trade
EURUSD - CORRECTIONEURUSD Printed an Impulse yesterday which indicates there are lot of demand for EURO. Now, It's correcting the impulse to shoot higer in NY Session today!
We request you to enter with your own confirmation!
Thank us later!

SAND/USDT Complex correctionwe're in the complex correction for more than 3 months a bullish run can be expected after breaking out
#elliott
