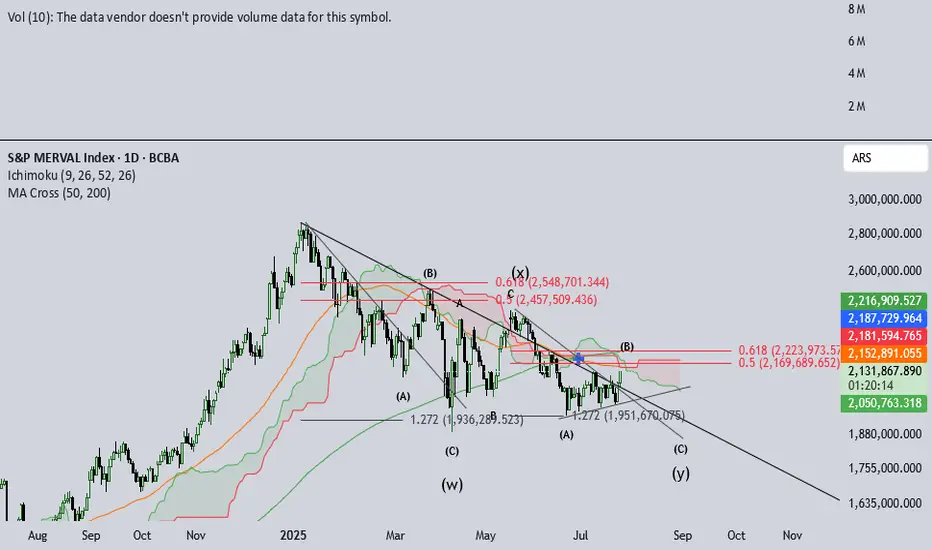
IMV Multiple analysisIMV, Argentina's Merval Index valued in pesos, has been in a downtrend since jan-25. Due to electoral process, noise has been increasing this last week, amidst some shade on what seemed as an easy win for Milei's gov.
The amount of chatter the Merval has brought up is inmense. This psychology is similar to that expected in IVth elliott's waves. Also, jul 2022 - dic 2024 saw huge gains, signaling IIIrd elliot´s wave behavior.
This long and extended IVth can be seen after such huge rallies. Anxiety begins to build up and retail investors begin to be shaken out. This IVth wave seems to be a triple-three type. Volatile and fast, this structure destroys an investor's patience.
Recent developements in the money market seem to have calmed down and peace seems to be partially restored. September elections are around the corner and this little Pax may be threatened.
I'm inclined to believe NOTHING WILL HAPPEN in these elections the govt faces, nor will the gov succeed enourmously, nor will it fail badly. So, I believe the index will likely test previous (W) wave bottoms, to then breakout for a final Vth wave. This analysis is compatible with a triangle-shaped breakout.
IMV
IMV: Channel + Anticipatory H&SMayor Pattern: Channel
Daily Pattern: Anticipatory H&S
Trigger Point 92200~


IMV back at key technical levelIMV surged during late trading on 7/23 with post market action taking it to highs of $3 and ultimately settling back around $2.65. There are a few areas to follow that appeared on the chart after plotting some fibs and looking for s/r areas. First, the aftermarket price lines up with a very consistent level of support/resistance between last May and present day. You've also got the 200DMA, which sat around $3 on Friday and clearly was a level that put the brakes on that late session rally. Both areas will be interesting to watch at the top of the week. Further, IF it can make it through both levels , you've got the 618 & 50 fib line levels to keep an eye on. In both cases, they've aced as some s/r levels in the past few months. Fundamentally, we've also got some filings to keep in mind (pennystocks.com).

IMV ALZA - IMV LONGSe ve un claro patron chartista triangulo, con una entrada al alza, tendencia alcista, TP 100 pips y SL 50 pips

VIST largoQuiebre de la MA de 50 con volumen y realiza throback de reversion alcista con descenso del volumen

#IMV - IMC INC.Daily chart. Coming into an area of support from the bottom of the wedge pattern plus area of price support denoted by the green box. Daily this is also oversold. Daily 200 day moving average is under duress as well. I am looking at this play to bounce in this area with a price target short term $5.20.

LONG GGALTanto en GGAL Local como en GGAL ADR veo posibilidades de Set Up alcista.
Divergencias alcistas activas como clusters de fibonacci dentro de zonas.
La zona celeste, indica acumulacion.
Por debajo de la zona celeste es cierre de posicion (depende del volumen)
Administrar muy bien stops y take profit.
Recuerden, mas que un buen gatillo, lo que importa es saber administrar correctamente una buena como mala operacion.
Cualquier consulta para operar
aacosta@estructurasfinancieras.com.ar

LOMAEn el caso de que vuelva a 102 se podría presentar una gran oportunidad de compra, en caso de romper el máximo anterior probablemente entre en un rally alcista impulsado por fundamentales como que el gobierno buscara una reactivación económica por medio de políticas keynesiana y por un aumento de la inversión privada en el desarrollo inmobiliario debido a los precios baratos de construcción en dólares

GGAL LONG LARGO PLAZOVa explicacion
Como mostre en un grafico anterior galicia habia llegado a un maximo en zona de resistencia indicado por techo de tenedor, zona de fibonacci y agotamiento de momentum.
La correccion: Esta llego al 38,2%. es un nivel importante, lo alcanzo hoy justo en la LT bajista roja.
Puede rebotar en el 38,2% y comenzar onda 3/C o puede profunzidar al 50% ($94) y de ahi salir.
Dato: El 70% de las veces la onda 2/B retrocede al 50-61,8% de 1/A.
Si rebota ahora, comprar en nuevo maximo, si sos mas agresivo esperar a que rompa la LT negra.
Espero haber explicado bien.

$IMV analysis with trend and resistance linesI'm a beginner trying to learn the use of trend and resistances lines. I request you to comment with some feedback please.

MervalIMV lamentablemente perdió TODA la suba desde las PASO, esta semana intento ir a buscar la WMA21 sin éxito y volvió a caerse. los 22400 pts aparecen como posible piso, pero todo quedará sujeto al lunes cuando Guzmán anuncie la propuesta de los bonos. Por ahora no hay señales de compra, solo podemos decir favorable que tanto el MACD como el RSI tienen divergencias alcistas de corto plazo

IMVMientras no supere la WMA21 sigue siendo un mero rebote técnico, a no apurarse los mas conservadores

Merval en pesos$IMV, vemos como el merval no pudo despegarse de las bolsas del mundo y tbm se desplomó un 50% desde máximos, a CASI el piso post paso, en realidad lo quebró así que no seria un doble piso. si bien tuvimos las últimas 2 ruedas positivas, por ahora no es mas que un mero rebote técnico. Hoy fue de mayor a menor y termino con sabor a poco. RSI en sobreventa. MACD en venta pero queriendo recuperarse. Mientras el indice no supere la WMA21 en base cierre, no tenemos confirmación de reversión.


Merval Dolares CCLLuego del derrumbe post Paso (tomado todo como onda A) el rebote en ‘pisos‘ fue una onda B, ante la potencial victoria del candidato Fernandez podemos intuir que la alta volatilidad del mercado acelere la onda C (bajista en este caso) pero en escenarios con eventos de alta volatilidad recomiendo NO OPERAR a menos que se este dispuesto a correr riesgos de perdida total de posición

$IBOV al limite en el cierre de la semanaEl índice de la bolsa brasilera cerró esta semana en los 102.900 puntos, estacionándose sobre la linea de tendencia bajista que trae desde hace dos meses. Si bien falló en el primer intento de quebrarla, parece haber conformado un pequeño banderín alcista.
El próximo lunes parece ser decisivo para ver si logra quebrarla. De hacerlo, se habilitaría el objetivo de 106.000 puntos y máximo histórico (objetivo planteado por el Inverse Head And Shoulders formado durante el último mes). En caso de no prosperar y rebotar en el soporte dinámico, iríamos a la zona de 101.000 puntos como primer objetivo.
Por último, el MACD no da señales buenas en el gráfico de 60 minutos pero si lo hace en gráficos de 2, 3 y 4 horas.
A esperar y ver cómo define.

$IBOV semanal, no pinta nada bien...Divergencia bajista clara en el índice de la bolsa brasilera, timeframe semanal (1W). Ya ejecutó una corrección, veremos si es suficiente o si va por más. Hasta no quebrar la línea de tendencia bajista roja (en el chart de 60 min.) no podemos darla por terminada. Lo positivo: apoyó en el retroceso 0.618 y salió, se mantuvo dentro del canal alcista. A esperar.

Monitoreando el $IBOVLuego de quebrar linea de tendencia bajista de corto plazo, $IBOV se toma un respiro. Veremos hasta donde llega el retroceso. Si confirma soporte por encima de los 99.200 estamos en condiciones de entrar.


EWZ Brazil ETF Buy SignalUsing macd MTF in weekly and daily time We can see a EWZ Brazil Buy Signal for long trade.

"Top and Bottom Analysis" GGAL by ThinkingAnts4H CHART EXPLANATION
- As in our Weekly / Daily Vision, price bounced from the Confluence Level and broke the Ascending Channel.
- It has potential to move down towards the 17,94 Support Zone.
- However, theres a Bullish Divergence wich could be anticipating a Pullback to the Broken Ascending Channel.
We will be waiting for a resolution before looking for sell setups.
Updates comming soon!
MULTI TIMEFRAME VISION:
- Weekly
- Daily

