IMXUSDT – Major Breakout or Another Painful Trap Ahead?Yello Paradisers, is this the real start of a powerful bullish reversal on #IMX, or just another classic setup to liquidate impatient traders before the true move begins? The next few days will decide everything.
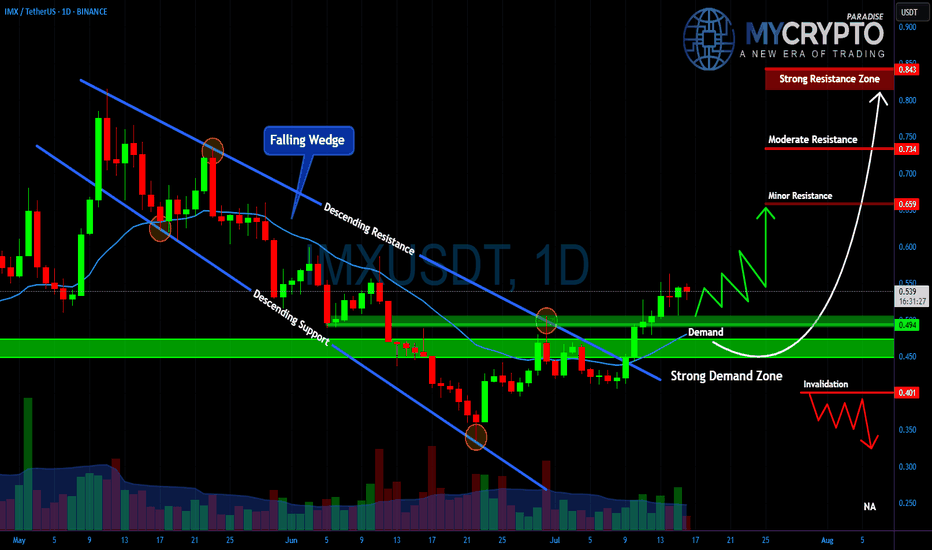
💎#IMXUSDT has broken out of a falling wedge, which is a typical bullish reversal structure, and is now retesting the strong demand zone between $0.45 and $0.49. As long as the price holds above this level, the bullish scenario remains intact, with $0.659 as the first key resistance to watch.
💎A clean break above $0.659 could open the way toward $0.734, while the critical resistance zone at $0.843 will be the ultimate test of whether IMX can shift into a sustained uptrend.
💎However, the invalidation level sits at $0.401. If this level fails, expect a fast move back toward $0.30, which will likely wipe out many traders who jumped in too early.
This is exactly where most retail traders get trapped. They either chase the move too late or panic-sell too early.
MyCryptoParadise
iFeel the success🌴
IMXUSD
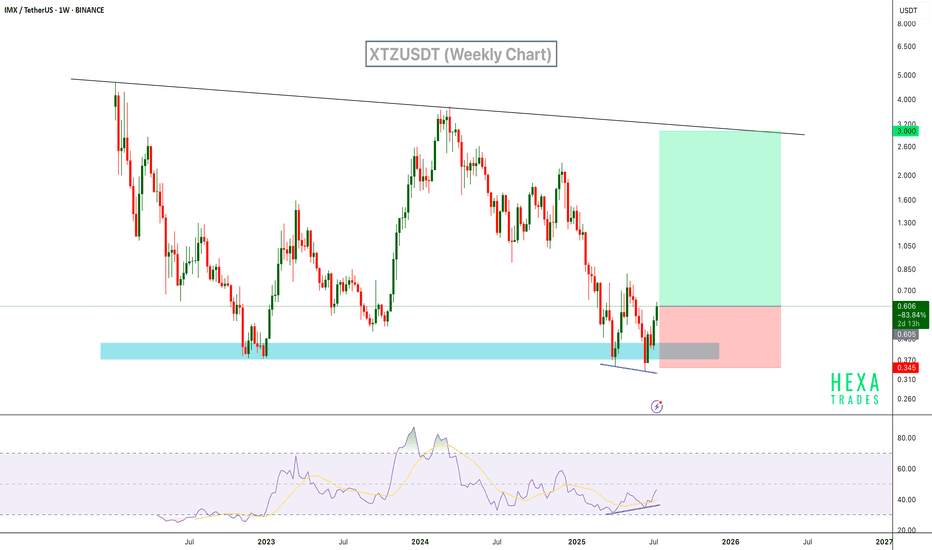
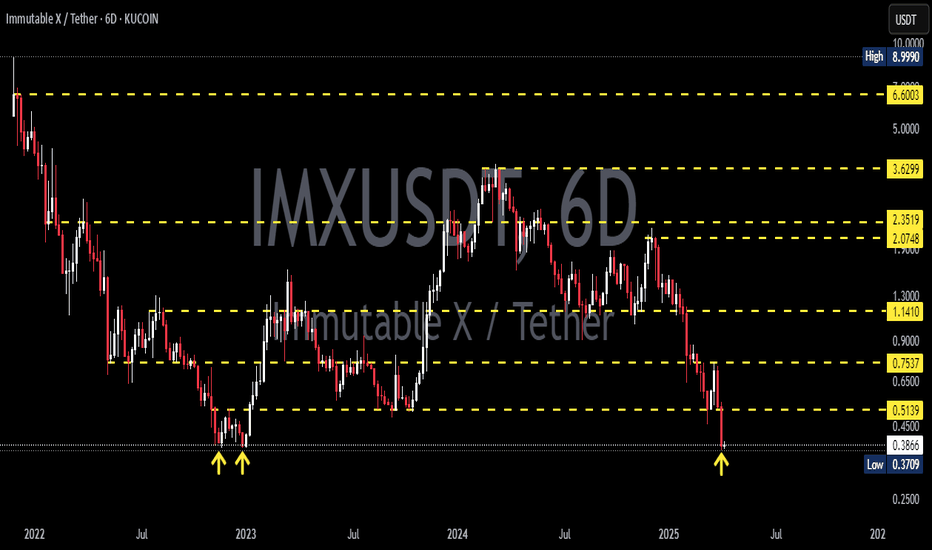
IMX Signals Reversal with RSI Bullish DivergenceIMX has shown a strong bounce from a demand zone, backed by clear bullish divergence on the RSI. Price printed a higher low on the oscillator while price action formed a lower low – a classic reversal signal. This area has acted as support multiple times in the past, and we can expect a reversal from the current support level.
Resistance 1:
Resistance 2:
Resistance 2:
Cheers
Hexa
BINANCE:IMXUSDT CRYPTO:IMXUSD
Over 140% profit with IMX (3D)IMX appears to be in a large wave B, which is forming a triangle. It is currently at the end of wave d of B.
It is expected that upon touching the green zone, wave e of B will begin, pushing the price into a bullish phase.
We are looking for buy/long positions in the green zone.
A weekly candle closing below the invalidation level will invalidate this analysis.
For risk management, please don't forget stop loss and capital management
When we reach the first target, save some profit and then change the stop to entry
Comment if you have any questions
Thank You
#IMX/USDT#IMX
The price is moving within a descending channel on the 1-hour frame, adhering well to it, and is heading for a strong breakout and retest.
We are seeing a bounce from the lower boundary of the descending channel, which is support at 0.599.
We have a downtrend on the RSI indicator that is about to be broken and retested, supporting the upward trend.
We are looking for stability above the 100 moving average.
Entry price: 0.602
First target: 0.649
Second target: 0.682
Third target: 0.721
#IMX/USDT#IMX
The price is moving within a descending channel on the 1-hour frame, adhering well to it, and is heading for a strong breakout and retest.
We are seeing a bounce from the lower boundary of the descending channel, which is support at 0.390
We have a downtrend on the RSI indicator that is about to be broken and retested, supporting the upward trend.
We are looking for stability above the 100 moving average.
Entry price: 0.407
First target: 0.426
Second target: 0.449
Third target: 0.480
#IMX/USDT#IMX
The price is moving within a descending channel on the 1-hour frame and is expected to continue upward.
We have a trend to stabilize above the 100 moving average once again.
We have a downtrend on the RSI indicator, which supports the upward move with a breakout.
We have a support area at the lower boundary of the channel at 0.503.
Entry price: 0.0528
First target: 0.540
Second target: 0.560
Third target: 0.587
IMX looks bullish (12H)The IMX pair has hunted a strong origin of movement, which is the key factor behind our bullish outlook on this coin.
After the hunt, this strong origin broke the trigger line, forming a bullish CH on the chart. Now, as the price pulls back toward support zones, we are looking for buy/long positions.
The targets are marked on the chart.
A daily candle close below the invalidation level will invalidate this analysis.
For risk management, please don't forget stop loss and capital management
When we reach the first target, save some profit and then change the stop to entry
Comment if you have any questions
Thank You
IMX Long SL -12.83%IMX/USDT Long Setup
Reason:
Successfully Breakout from Major trend.
Break of Internal Structure.
Strong Bullish Momentum.
Resting on Major Support.
Taken All possible Liquidity.
All technical indicators suggesting Strong bullish Wave
Best Regards,
The Panda
Pro tip:
Hold !
BINANCE:IMXUSDT.P
BINANCE:IMXUSDT
COINBASE:IMXUSDC.P
MEXC:IMXUSDT
IMX - Immutable X getting more bullish for retestsWe could see a Bullish push to retest $1.12 for a 38% gain Take Profit Target 1, and a more bullish retest at $1.48 for a 81% gain for Take Profit Target 2.
Indicators coming off their lows and ramping upwards.
Price is moving upwards to converge with the 200MA near the $1.15 mark.
Its gonna happen soon...tick tock!
Lets Get This Money!!!
www.tradingview.com
Will #IMX Bulls Get Enough Momentum For a Bullish Reversal?Yello, Paradisers! Is #IMXUSDT ready to make a decisive move, or are we in for more consolidation? Let’s dive into the key levels of #Immutable:
💎#IMX has been trading within a descending channel on the 4-hour timeframe, creating a classic pattern of lower highs and lower lows. #IMXUSD got rejected from the descending resistance at $1.52 and is going to lower levels for liquidity capture.
💎For a bullish breakout, #IMX needs to push above the descending resistance near $1.524. A confirmed close above this level would pave the way for a potential rally toward the $2.000–$2.200 major resistance zone, where sellers are likely to step in. This scenario hinges on strong bullish momentum and volume so you can watch these for confirmation.
💎If #Immutable cannot get enough momentum to breach above the descending resistance then the probability is high that it will go lower for support. The support zone between $1.072 and $0.906 is crucial. This level has held firm during recent declines, providing a solid base for price action. The bulls have previously stepped here on these levels and defended them.
💎However, if #IMXUSDT breaks below $0.906 and closes a candle below this strong support, the bullish outlook will be invalidated. In this case, #IMX could retest lower levels, with the next key zone around $0.800 or lower, signaling a significant shift in market sentiment.
Stay focused, patient, and disciplined, Paradisers🥂
MyCryptoParadise
iFeel the success🌴
#IMX/USDT Ready to launch upwards#IMX
The price is moving in a descending channel on the 4-hour frame and sticking to it well
We have a bounce from the lower limit of the descending channel, this support is at 1.30
We have an upward trend on the RSI indicator that is about to be broken, which supports the rise
We have a trend to stabilize above the moving average 100
Entry price 1.46
First target 1.56
Second target 1.64
Third target 1.74
IMX looks bullish (2D)IMX appears to be within a large diametric pattern and is currently in the middle of Wave D. If it maintains the green zone, it could continue its upward movement for a long time to complete Wave E.
The long-term and mid-term targets are between $5.5 to $7.0.
A daily candle closing below the invalidation level would invalidate this analysis.
For risk management, please don't forget stop loss and capital management
Comment if you have any questions
Thank You
#IMX/USDT Ready to go higher#IMX
The price is moving in a descending channel on the 1-hour frame and sticking to it well
We have a bounce from the lower limit of the descending channel, this support is at 2.00
We have a downtrend on the RSI indicator that is about to break, which supports the rise
We have a trend to stabilize above the moving average 100
Entry price 0.02
First target 2.08
Second target 2.17
Third target 2.29
#IMX/USDT#IMX
The price is moving in a descending channel on the 12-hour frame upwards and is expected to continue.
We have a trend to stabilize above the moving average 100 again.
We have a downtrend on the RSI indicator that supports the rise by breaking it upwards.
We have a support area at the lower limit of the channel at a price of 1.35.
Entry price 1.50.
First target 1.62.
Second target 1.78.
Third target 1.90.
IMX | ALTCOINS | Altcoin that CAN STILL +25%Immutable (IMX) is one of few good alts tat hasn't quite seen the parabolic increases that the rest of the altcoin market has seen.
IMX still has some room for growth until it hits the next major resistance zone, and even more if you consider the previous ATH at 4.6 (currently at 2$).
Make sure you don't miss the Bitcoin update, and why I say the ATH is in :
___________________
BINANCE:IMXUSDT
#IMX (SPOT) entry range(1.150- 1.400) T.((2.119) SL(1.104)BINANCE:IMXUSDT
entry range (1.150- 1.400)
Target (2.119)
1 Extra Targets(optional) in chart, if you like to continue in the trade with making stoploss very high.
SL .1D close below (1.104)
*** collect the coin slowly in the entry range ***
*** No FOMO - No Rush , it is a long journey ***
**** #Manta ,#OMNI, #DYM, #AI, #IO, #XAI , #ACE #NFP #RAD #WLD #ORDI #BLUR #SUI #Voxel #AEVO #VITE #APE #RDNT #FLUX #NMR #VANRY #TRB #HBAR #DGB #XEC #ERN #ALT #IO #ACA #HIVE #ASTR #ARDR #PIXEL #LTO #AERGO #SCRT #ATA #HOOK #FLOW #KSM #HFT #MINA #DATA #SC #JOE #RDNT #IQ #CFX #BICO #CTSI #KMD #FXS #DEGO #FORTH # AST #PORTAL #CYBER #RIF #ENJ #ZIL #APT #GALA #STEEM #ONE #LINK #NTRN #COTI #RENDER #ICX #IMX ****
Is #IMXUSDT on the Edge of Major Breakout? What You Should KnowYello, Paradisers! Are we about to witness a massive bullish rally of the #IMX or pullback could be on the horizon? Let’s break down the #Immutable's price action:
💎#IMXUSDT is showing strong potential for a bullish continuation as it hovers above a critical demand zone at $1.22. We've been closely monitoring #Immutable as it moves through a falling wedge pattern—a setup that often signals an imminent breakout. The next target in sight? The internal minor resistance at $2.02.
💎If #IMX holds strong at this resistance, we could be on the cusp of a significant bullish rally, reminiscent of past explosive market moves. A successful breakout above the key resistance at $2.02 could open the doors to higher resistance zones, potentially driving the price even further.
💎However, caution is crucial here. If momentum weakens at this critical demand zone, we might see a pullback to the lower demand area, ranging between $0.90 - $1.02.
💎Stay vigilant and closely watch the CRYPTOCAP:IMX price action. A daily close below this demand area could invalidate the bullish outlook and pave the way for further declines.
Stay focused, patient, and disciplined Paradisers.
MyCryptoParadise
iFeel the success🌴
IMX MASSIVE Higher Lows and Price Structure ! The golf ball was hit in November 2022, and since then, the CRYPTOCAP:IMX price has been moving in the direction of this triangle, making higher lows.
Immutable-X ( CRYPTOCAP:IMX ) is the 'Apple' of the blockchain gaming ecosystem and as the gaming ecosystem grows, the CRYPTOCAP:IMX price will eventually reach its targets.


