IMXUSDT – Major Breakout or Another Painful Trap Ahead?Yello Paradisers, is this the real start of a powerful bullish reversal on #IMX, or just another classic setup to liquidate impatient traders before the true move begins? The next few days will decide everything.
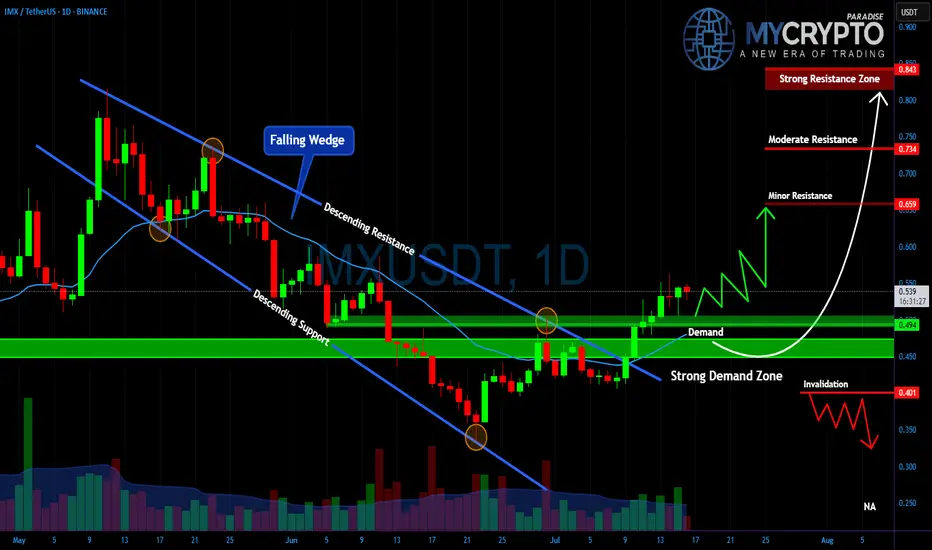
💎#IMXUSDT has broken out of a falling wedge, which is a typical bullish reversal structure, and is now retesting the strong demand zone between $0.45 and $0.49. As long as the price holds above this level, the bullish scenario remains intact, with $0.659 as the first key resistance to watch.
💎A clean break above $0.659 could open the way toward $0.734, while the critical resistance zone at $0.843 will be the ultimate test of whether IMX can shift into a sustained uptrend.
💎However, the invalidation level sits at $0.401. If this level fails, expect a fast move back toward $0.30, which will likely wipe out many traders who jumped in too early.
This is exactly where most retail traders get trapped. They either chase the move too late or panic-sell too early.
MyCryptoParadise
iFeel the success🌴
IMXUSDT
IMX Signals Reversal with RSI Bullish DivergenceIMX has shown a strong bounce from a demand zone, backed by clear bullish divergence on the RSI. Price printed a higher low on the oscillator while price action formed a lower low – a classic reversal signal. This area has acted as support multiple times in the past, and we can expect a reversal from the current support level.
Resistance 1:
Resistance 2:
Resistance 2:
Cheers
Hexa
BINANCE:IMXUSDT CRYPTO:IMXUSD
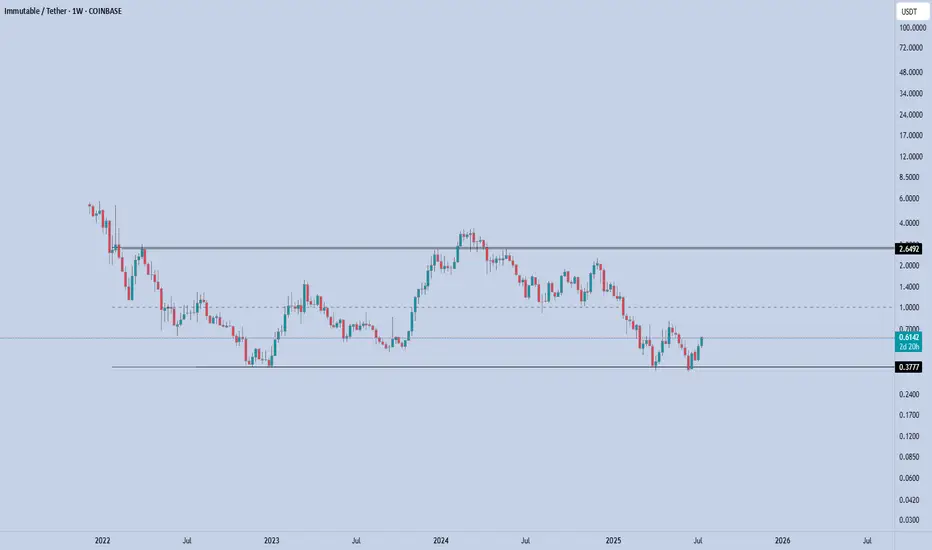
IMX – Range Low ReclaimedIMX has once again defended the $0.37–0.38 demand zone, bouncing sharply off the lows. This level has acted as a long-term accumulation base since late 2022, and price is now showing early signs of another range rotation.
Currently trading at $0.61, IMX is holding above the reclaimed support. As long as this level is maintained, the setup favors a move toward the mid-range and potentially the upper boundary of the established range.
🎯 Key Levels:
Support: $0.38 (range low & invalidation)
Mid-range: $1
Target: $2.65 (range high)
If bulls can push through the $1 mid-range resistance, the top of the range at $2.65 becomes the next magnet.
📌 Risk Management:
$0.38 is the line in the sand. A close below this level breaks the structure and invalidates the setup.
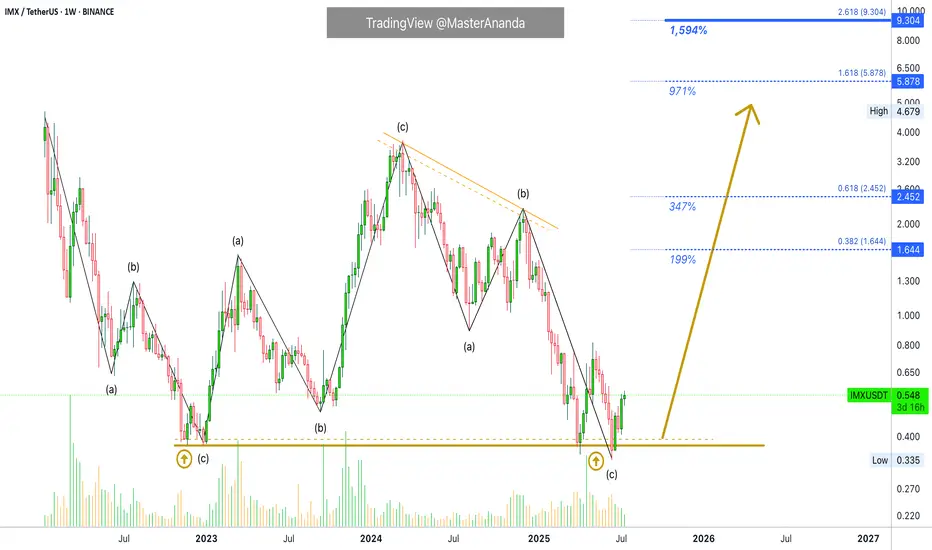
A New All-Time High Guaranteed for ImmutableX (1,600% PP)IMX produced a strong bullish cycle between December 2022 and March 2024. The entire bullish wave was corrected beyond 100%. This means that IMXUSDT hit a lower low. It went below the starting point of the last bullish wave. This is good in several ways.
The last move being deleted in its entirety opens the doors for a new bullish cycle with unlimited growth potential. We also know that all weak hands have been removed. Anybody who wanted to sell had more than a year to do so with all profits erased from the previous cycle. A total flush, a full reset.
The last bullish cycle produced more than 850%. We now know that this much is do-able so it becomes very easy. Last time market conditions were mixed to say the least, but not extremely bullish nor the best possible.
If IMXUSDT can grew this much in a mixed market, how much can it grow in a favorable market, in a bull market?
So, we aim for a strong higher high, a new all-time high. This opens up $5.9 an $9.3 as target for this newly developing bullish phase.
Thank you for reading.
Namaste.
IMXUSDT 6D AnalysisIMX ~ 6D Analysis
#IMX This is the lowest support block for now. Buy if you still have faith in this coin with a short term target of at least 20%+ from this support

$MAGIC is breaking out after 30+ days of consolidation!Now testing the trendline with strong support at $0.16–$0.17 and holding above the 100 EMA.
If confirmed, we could see a move toward $0.36+ 🚀
Entry: CMP $0.1811
SL: $0.1631
Target: $0.3623
DYRO, NFA

$IMXUSDT looks bullishSEED_DONKEYDAN_MARKET_CAP:IMX looks bullish on the daily chart after a clean breakout and retest of the $0.595 support.
Price is holding above the trendline and 100MA, signalling strength.
If momentum continues, the next target is around $1.03.
DYOR, NFA.

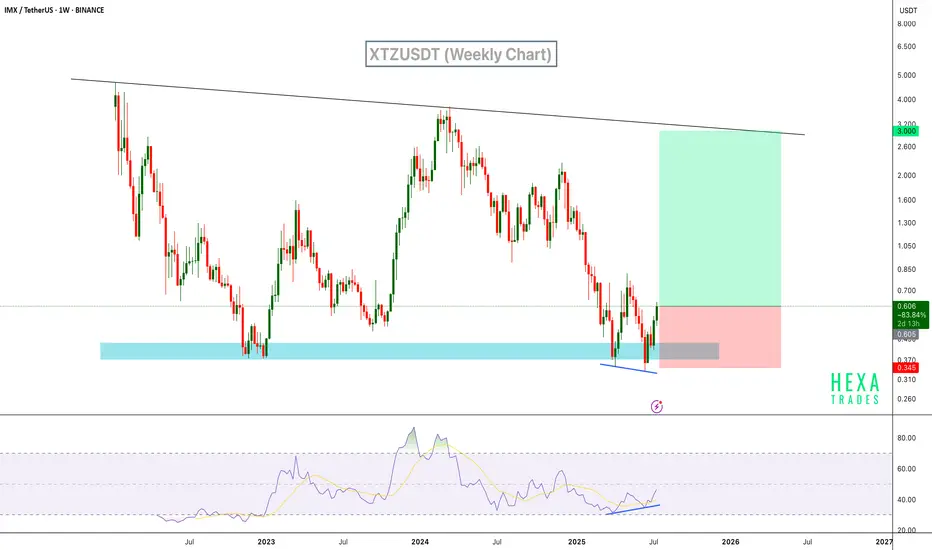
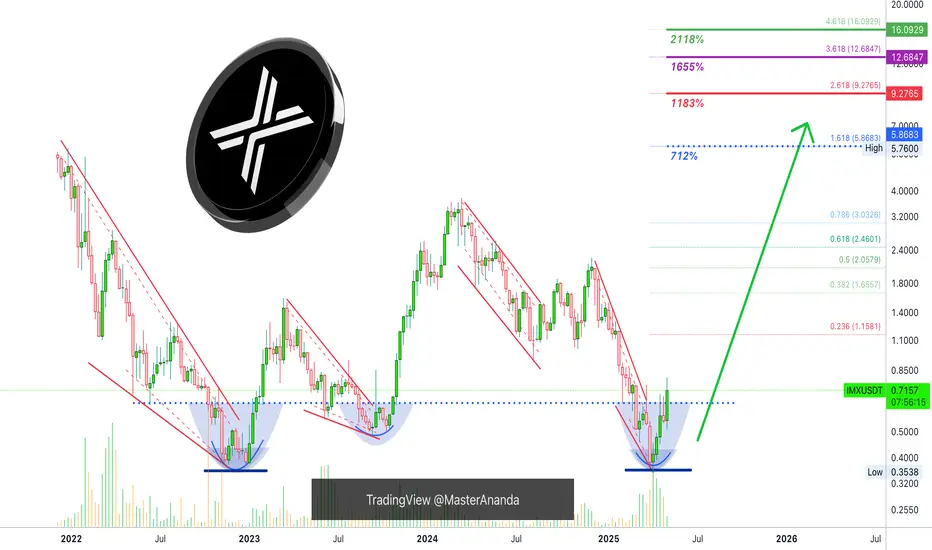
Immutable Long-Term Support Established (New 3000% Wave Starts)Here we have the establishment and confirmation of a long-term support and double-bottom. IMXUSDT activated in April 2025 the same level and low as back in November 2022.
From November 2022 through March 2024 IMX went bullish. This bullish cycle produced 900% total growth (10X).
From March 2024 through April 2025 IMX went bearish. This bearish period removed all gains from the previous bullish cycle. A complete reset.
Now IMXUSDT is back to zero and anything is possible. This project can grow 1,655% as shown on the chart just as it can grow 3,000% or even 10,000%.
The reason why I cannot make a more accurate prediction about the next All-Time High is because there is not enough chart data. Immutable was not present in the last bull market so we don't know how this pair is likely to behave in a similar cycle.
900% growth is quite decent in the transition/recovery year, so I wouldn't be surprised to see at the minimum 2,000% to 3,000% growth in the coming months. Can be more, can be less, but it will grow.
Looking closer, in the last three months IMXUSDT produced a classic rounded bottom pattern. This week, the action is moving back above the baseline; the bullish zone.
This weekly session closes in just a few hours. Once the week closes above the blue dotted line, this signal is fully confirmed. The same signal from early 2023. This clearly shows what I've been saying, we will have a bull market now, in 2025. Prepare for long-term growth.
Namaste.
Over 140% profit with IMX (3D)IMX appears to be in a large wave B, which is forming a triangle. It is currently at the end of wave d of B.
It is expected that upon touching the green zone, wave e of B will begin, pushing the price into a bullish phase.
We are looking for buy/long positions in the green zone.
A weekly candle closing below the invalidation level will invalidate this analysis.
For risk management, please don't forget stop loss and capital management
When we reach the first target, save some profit and then change the stop to entry
Comment if you have any questions
Thank You

IMX - Is it a movie?IMX Looks like a structure is broken for everyone to watch, but the stances is as shown below!!!!!! We can see that the price was building value comfortably above $0.63–$0.65 until May 2nd. Then, a strong selling move broke below that range, followed by a new value area formation below $0.59, showing that sellers are in control and the market is accepting these lower prices. The latest session has POC, VAH, and VAL tightly compressed near $0.563, which means extremely low volatility and a potential setup for the next expansion.
But what i suggest is this, will take a last breather or just go to the next block marked as orange, can have dead cat bounces!!

#IMX/USDT#IMX
The price is moving within a descending channel on the 1-hour frame, adhering well to it, and is heading for a strong breakout and retest.
We are seeing a bounce from the lower boundary of the descending channel, which is support at 0.599.
We have a downtrend on the RSI indicator that is about to be broken and retested, supporting the upward trend.
We are looking for stability above the 100 moving average.
Entry price: 0.602
First target: 0.649
Second target: 0.682
Third target: 0.721

#IMX/USDT#IMX
The price is moving within a descending channel on the 1-hour frame, adhering well to it, and is heading for a strong breakout and retest.
We are seeing a bounce from the lower boundary of the descending channel, which is support at 0.390
We have a downtrend on the RSI indicator that is about to be broken and retested, supporting the upward trend.
We are looking for stability above the 100 moving average.
Entry price: 0.407
First target: 0.426
Second target: 0.449
Third target: 0.480

#IMX/USDT#IMX
The price is moving within a descending channel on the 1-hour frame and is expected to continue upward.
We have a trend to stabilize above the 100 moving average once again.
We have a downtrend on the RSI indicator, which supports the upward move with a breakout.
We have a support area at the lower boundary of the channel at 0.503.
Entry price: 0.0528
First target: 0.540
Second target: 0.560
Third target: 0.587

IMXUSDT 6DIMX ~ 6D Analysis
#IMX The last support that must be maintained. Losing this support will make prices more depressed.

IMX looks bullish (12H)The IMX pair has hunted a strong origin of movement, which is the key factor behind our bullish outlook on this coin.
After the hunt, this strong origin broke the trigger line, forming a bullish CH on the chart. Now, as the price pulls back toward support zones, we are looking for buy/long positions.
The targets are marked on the chart.
A daily candle close below the invalidation level will invalidate this analysis.
For risk management, please don't forget stop loss and capital management
When we reach the first target, save some profit and then change the stop to entry
Comment if you have any questions
Thank You

IMXUSDT 6DIMX ~ 6D Analysis
#IMX Buy gradually from here if you still have a Conviction on this coin with a short -term target of at least 20%+.
This is the lowest support block for now.

IMX Long SL -12.83%IMX/USDT Long Setup
Reason:
Successfully Breakout from Major trend.
Break of Internal Structure.
Strong Bullish Momentum.
Resting on Major Support.
Taken All possible Liquidity.
All technical indicators suggesting Strong bullish Wave
Best Regards,
The Panda
Pro tip:
Hold !
BINANCE:IMXUSDT.P
BINANCE:IMXUSDT
COINBASE:IMXUSDC.P
MEXC:IMXUSDT

TradeCityPro | IMXUSDT Potential 30% Drop👋 Welcome to TradeCityPro Channel!
Let’s take a look at today’s altcoin on this market holiday, especially for those holding IMX, as it might experience a drop once the market reopens.
Before starting the analysis, as always, let's first check Bitcoin. On the 1-hour timeframe, Bitcoin dropped last night after getting rejected at 105,939, making a sharp move down to support at 101,654, where it is currently holding.
Along with this drop, Bitcoin dominance also fell, preventing altcoins from experiencing significant losses. However, as Bitcoin ranges at this support, its dominance is rising, which is causing altcoins to drop. If this trend continues, altcoins will likely undergo a deeper correction.
I personally plan to open a short position if 101,654 breaks, but I will secure profits quickly and exit fast. On the other hand, if Bitcoin breaks 102,571, I will enter a risky stop-buy long position, as I believe its movement to the upside could be as sharp as its previous drop, and I will set a logical stop-loss.
📉 Weekly Timeframe
Looking at the IMX weekly chart, we see that compared to 2023, it is holding a higher low, which is a bullish sign. However, the fake breakout and rejection at 1.817 led to a return inside the range, and sellers are now attempting to break the range low.
Let’s also talk about the candlestick pattern I highlighted on the chart. I’ve personally seen this pattern many times—it typically appears at the end of a trend and signals a potential reversal. I will discuss it more in the future, but for now, just take note of this behavior.
Additionally, after last week’s candle, IMX is trying to close below the key weekly support and range low at 1.084. If this breakdown is confirmed, it would signal a range breakdown, leading to a bearish correction towards the next major support at 0.764, which would be a 30% drop.
I do not hold IMX, but if I did, my approach would be to exit my holdings upon a weekly close below this level, regardless of whether I was in profit or loss. I would only re-enter if the price reclaimed the range or formed a clear trigger for a new buy position.
📊 Daily Timeframe
IMX is currently sitting on a major support level, which has consistently pushed the price upward in previous attempts. However, this support is showing signs of weakening.
If this level breaks, we will likely see a sharp drop towards 0.764. Given the importance of this level, it’s essential to monitor both bullish and bearish signals. If we see signs of weakness in the bearish trend, it could signal a buy trigger.
However, these triggers require momentum—I will not buy just because the price is sitting on a strong support level. Instead, I will wait for either a fake breakdown or a lower timeframe range breakout before considering a buy. One possible entry trigger could be the breakout of the trendline at 1.252.
⏳ 4-Hour Timeframe
IMX is currently breaking below the 1.061 support, which is a key weekly level. Because this is a high-volatility zone, it’s important to use a logical stop-loss when entering positions to avoid being stopped out unnecessarily.
📉 Short Position Trigger
the trigger is already active, so a short entry is possible. However, if the price lingers in oversold conditions for too long or takes too long to move downward, I recommend securing profits quickly—also keep in mind that it’s Saturday, so consider reducing your risk exposure.
📈 Long Position Trigger
there is no clear trigger yet unless we see a fake breakdown or a sharp recovery back to 1.252, after which a long entry would be valid. If this scenario plays out, there’s no need to feel FOMO, as strong momentum entering the market will provide multiple trading opportunities.
📝 Final Thoughts
Stay calm, trade wisely, and let's capture the market's best opportunities!
This analysis reflects our opinions and is not financial advice.
Share your thoughts in the comments, and don’t forget to share this analysis with your friends! ❤️

Immutable will be trending to the UPSIDE!Hi fellow traders, IMXUSDT is ready to make a move higher after completing the correction in ABC formation. Target the 4.1107 level. Good luck and trade safe!


IMX Bullish Wave Analysis, for investment!IMX is completing Wave 4 correction around $1.00, preparing for Wave 5 upside. The breakout from the wedge pattern confirms bullish momentum.
📈 Target Levels (Fibonacci Extensions):
$4.48 (1.27 Fib)
$7.60 (2.27 Fib)
$13.90 (4.272 Fib)
🔍 Key Levels to Watch:
Support: $1.00 (Wave 4 bottom)
Breakout Confirmation: $1.60 - $2.00
If market conditions remain strong, IMX could see massive upside in the next bull run! 🚀
#IMX #Crypto #ElliottWave #BullRun #Altcoins

Will #IMX Bulls Get Enough Momentum For a Bullish Reversal?Yello, Paradisers! Is #IMXUSDT ready to make a decisive move, or are we in for more consolidation? Let’s dive into the key levels of #Immutable:
💎#IMX has been trading within a descending channel on the 4-hour timeframe, creating a classic pattern of lower highs and lower lows. #IMXUSD got rejected from the descending resistance at $1.52 and is going to lower levels for liquidity capture.
💎For a bullish breakout, #IMX needs to push above the descending resistance near $1.524. A confirmed close above this level would pave the way for a potential rally toward the $2.000–$2.200 major resistance zone, where sellers are likely to step in. This scenario hinges on strong bullish momentum and volume so you can watch these for confirmation.
💎If #Immutable cannot get enough momentum to breach above the descending resistance then the probability is high that it will go lower for support. The support zone between $1.072 and $0.906 is crucial. This level has held firm during recent declines, providing a solid base for price action. The bulls have previously stepped here on these levels and defended them.
💎However, if #IMXUSDT breaks below $0.906 and closes a candle below this strong support, the bullish outlook will be invalidated. In this case, #IMX could retest lower levels, with the next key zone around $0.800 or lower, signaling a significant shift in market sentiment.
Stay focused, patient, and disciplined, Paradisers🥂
MyCryptoParadise
iFeel the success🌴

IMX in short term!BINANCE:IMXUSDT
It's ranging in a Broadening wedge pattern so the price should stay in it for now!
It might retest the bottom of it before ascending further!
⚠️ Disclaimer:
This is not financial advice. Always manage your risks and trade responsibly.
👉 Follow me for daily updates,
💬 Comment and like to share your thoughts,
📌 And check the link in my bio for even more resources!
Let’s navigate the markets together—join the journey today! 💹✨
