IMXUSDT: Navigating the Bearish Waves! 📉🌊Introduction: 🌐 Brace yourselves for a thrilling ride in the crypto seas with IMXUSDT! Traders are setting sail on a short position from $2.32, anticipating a correction in this overbought asset. Let's explore the details of this daring trade.
Trade Details: 💰 The short position (#IMXUSDT) sets sail from $2.32, with a stop-loss anchored at $2.61. The rationale behind this move lies in the asset being overbought and trading near a formidable resistance zone.
Technical Analysis: 📊 Navigating the 1-hour timeframe, it's evident that IMXUSDT is treading waters at a strong resistance zone, signaling a potential correction and the crossing of the FVG (Fibonacci Golden Zone).
Expectations and Strategy: 🎯 The plan unfolds with entering the position at the current price or at $2.33. Aiming for a 3-6-9% movement, with potential for one averaging down at the trader's discretion, it's a daring cross into bearish territory.
Trade Target: 📉 The anticipation is set for a 3-6-9% move, as the trader navigates the bearish waves in pursuit of profitable waters.
Conclusion: 🚢 IMXUSDT offers a thrilling opportunity to surf the bearish tides. Traders, fasten your seatbelts, set sail with caution, and ride the waves of potential profits in this exciting crypto journey! 🌊💹
IMXUSDT

Immutable ($IMX) Hits 20-Month High Gaming tokens are rising again, with Immutable's IMX token as well.
Crypto gaming firm Immutable’s CRYPTOCAP:IMX token has surged to highs not seen since April 2022, rising 77% in the past month to roughly $2.35, per CoinGecko data.
CRYPTOCAP:IMX is up about 428% in the past year and has a market cap of over $3 billion, making it one of the biggest gaming-focused cryptocurrencies. It’s up 11% in the last 24 hours alone.
Immutable, publisher of the NFT trading card game Gods Unchained, has continued to sign games to its upcoming zkEVM network this year, rolled out its single sign-on wallet solution called Immutable Passport, announced a mysterious collaboration with Ubisoft, and saw a number of games using its blockchain and marketplace listed on the Epic Games Store.
While blockchain games remain a niche interest among the crypto-native, development has continued on a number of upcoming games using Immutable, like Shardbound and Guild of Guardians.

#IMXIn the 30 -minute time, there is a move in a short upstream channel that can move to the floor of the channel of the support range in case of a positive reaction to the channel ceiling. Otherwise, with the defeat of the 2.14 area, it can be more corrected.

IMX NEW VOLUME INCREASEThank you for reading this update.
Depending on our study we see that IMX has a good chance of volume increase.
This updates depending on day trade, And the market should confirm with time the right market way.
#Nottradingadvice

**IMX |Major resistance ahead |Break it out for 580% gain**BINANCE:IMXUSDT
Hi fam,
Thanks for being here.
I'm sure you are experiencing a good time in crypto market these days but always remember "every uphill will end to a downhill" so prepare yourself for other side of market soon.
As you already know many altcoins recently popped up and returned good profit for all of us.
I've checked IMX chart in both weekly, daily time frame and all i can say is currently price reached a critical level of 1.3$. This is a major level for overall trend of this coin. price once made several touched to this level previously and made a deviation above that ended in rejection eventually.
regarding overall condition of market (i expect to see a minor correction) and chart it self (RSI overbought +MACD in H12 is red +BB upper boundary rejecting the price in D1+Stoch RSI in W1 is overbought).
i believe price will give me the opportunity of buying IMX around 0.9$ which is a 10% discount and of course an aggressive buying move.
0.9$ is where kij & tenk of ICHI cloud located and getting flat.
0.9$ is MA20 in W1 time frame.
0.8$ to 0.9$ are the last broken resistance and last known support for this trend.
|But why I'm buying IMX ?
Price located above MAs in W1 time frame.
MACD in W1 is green and getting stronger.
Price printed an ascending channel which give us 9$ as upper boundary of channel (sitting around fib. level of 8)
Trend broken the W1 bearish dynamic resistance trend line and closed above.
Price printed a harmonic XABCD bearish BAT pattern that will end D leg touching upper bound of channel.
There are more parameters that i checked but i will as always ask you to DYOR.


IMX coming downIMX looks like going down here with the double top parttern and low volume when back test in second top. RSI also show the regular divergence that give us a signal of weakness.

IMX ELLIOT Correction Short TermIMX made the elliot 1-2-3-4-5 movement, and now time for the ABC correction. Also its been moving in the channel since 3 november, i think it will follow the channel and go for the resistence now.(A point)

IMX: Resistance BreakoutTrade setup : After a brief consolidation phase around the $1.25 resistance price has broken above it to signal continuation of uptrend, with upside potential to $1.55 next.
Trend : Uptrend across all time horizons (Short- Medium- and Long-Term).
Momentum is Bullish (MACD Line is above MACD Signal Line and RSI is above 55).
Support and Resistance : Nearest Support Zone is $0.80 (previous resistance), then $0.55. The nearest Resistance Zone is $1.25, which it broke, then $1.55.

Immutable X (IMX) Price Could Face An Explosive SurgeNotable Trends
1. Immutable forges key partnerships with Amazon AWS and Ubisoft.
2. IMX jumped by 145%, influenced by strategic alliances.
3. Bullish momentum initiated, though short-term corrections are likely to occur.
Fundamentals
In a groundbreaking development for the web3 gaming sector, Immutable has recently solidified two pivotal partnerships, one with Amazon Web Services (AWS) and another with the esteemed game publisher Ubisoft, ushering in a revolutionary era in game development.
The native token IMX of Immutable X has experienced an impressive surge of nearly 145%, rebounding from a bear market low of $0.50 to the current value of $1.22. With its proximity to the yearly high of $1.56 set in March, the question arises: can this upward trend be sustained?
IMX Partnerships With Amazon AWS And Ubisoft
Unlike many crypto projects that announce partnerships primarily for attention, Immutable X stands out with purposeful collaborations.
Through its involvement in Amazon‘s ISV Accelerate Program, the partnership with AWS provides Immutable with valuable resources, such as access to a broad pipeline of game studio leads and support for successful deal closures. This collaboration is poised to revolutionize the gaming landscape, offering developers and studios a comprehensive platform and ecosystem for web3 gaming. The integration of cloud data with the Ethereum blockchain through this alliance marks a significant leap toward establishing a viable model for blockchain gaming.
IMX Price Analysis
IMX reached its all-time high of $9.50 on November 27, 2021, approximately three weeks following its market debut. This achievement coincided with the conclusion of the cryptocurrency bull market, initiating a multi-year period of depreciation for the token.
On December 31, 2022, IMX dipped to $0.37, marking its lowest point since its initial release. The onset of the current year witnessed a robust recovery of over 300%, reaching $1.56 on March 17. Subsequently, a retracement occurred, but a significant development unfolded as IMX established its first higher low at $0.50 on both September 11 and October 19, signaling the commencement of the present uptrend.
The current parabolic ascent post its first higher low hints at a potential initiation of a bull phase for IMX, further supported by the U-shaped curvature commonly observed at market bottoms. Nevertheless, caution is advised as the daily chart RSI indicates overextension, reaching 86% on November 6. It’s noteworthy that during previous instances of such overbought levels, the price similarly surged, as seen on January 17, continuing its ascent by another 166%.
IMX Price Prediction
Since its low on September 11 at $0.47, IMX has been on a steady ascent, reaching its peak at $1.23 today, reflecting an impressive 158% increase. This surge marks the sustained momentum from the breakout following its previous peak on March 17 at $1.57.
While the current price remains below its previous yearly high, there’s potential for further upward movement, suggesting a possible revisit to this high. The recent uptrend likely signifies the next phase in the emerging bull market, anticipating higher prices.
However, a short-term decline may precede a more significant upward move. This conjecture is based on the idea that the initial uptrend from the beginning of the year until March and the subsequent downtrend until September 11 might be the first two sub-waves of a larger uptrend.
If this hypothesis holds, the completion of the ongoing uptrend, now poised for a minor retracement, is crucial before a renewed push towards revisiting the March high. This would mark the conclusion of the current advance, followed by another lower degree downturn, ideally establishing the next higher low, preferably above $0.85.
Should this scenario unfold, IMX’s price could face an explosive surge, breaking through its $1.50 resistance and extending towards $3 in the next uptrend.
Imxusdt ,,, Triangle pattern In this 30-minute time chart, we see a nested triangle pattern, which can either go down or up, but it is more likely to go up because One can see the divergence in ( RSI ), which can grow as soon as the trend line breaks. and continue to climb

IMX ANALYSIS (1D)The IMX symbol appears to be inside a large diametric pattern. It is not far to expect that it will be inside a diametric. In the last few years, all altcoins have been in complex correction.
For branch F, it can jump up to the red box and then be rejected downwards
For risk management, please don't forget stop loss and capital management
Comment if you have any questions
Thank You

#IMXThe hourly time is pulling back to the broken resistance, which can continue to grow up to the specified areas and retest the resistance again.

ImmutableX (IMX) Continued Growth Despite Market Behaviours
Unlike other altcoins, the momentum on the IMX chart hasn't been as pronounced, presenting an opportunity for substantial future growth. Since October 19, the asset has increased by 30%, a relatively modest gain compared to other alternative cryptocurrencies.
At present, the IMX price is caught between a support zone of $0.608 and $0.632. If the uptrend continues, IMX's price could potentially reach $0.725 and $0.766, levels that were hit during ImmutableX’s surge on September 21.
Should the BTC chart depict a downturn, IMX could retest the support zone at $0.560-$0.580, as well as the $0.545 level. These marks may need to be tested as a technical correction before any further increase.

ICXUSDT (Icon) and the Range-Trading Conundrum🌟In the ever-evolving world of crypto, ICON (ICX) against USDT (Tether) presents an intriguing narrative. To comprehend this evolving scenario, we delve into the recent price action and pivotal technical indicators.
🌟Today, ICXUSDT witnessed a notable event – a clean rejection transpired at the 88.6% Fibonacci resistance level. This particular price juncture has significant implications, indicative of both short-term price dynamics and broader market sentiment. Concurrently, this level aligns with a robust supply zone that has established itself over the preceding six months.
🌟This confluence of technical factors spotlights the prevailing dominance of sellers within the IMXUSDT market. A critical aspect contributing to this bearish bias is the resolute failure of bullish forces to conquer the formidable supply zone. Their inability to breach this critical threshold amplifies the control wielded by sellers in this market.
🌟Furthermore, as we dissect the prevailing market structure, a compelling proposition emerges. The potential existence of a substantial range-trading zone complicates the traditional conception of trend dynamics. Instead, it sets the stage for more lateral price movements, rather than a decisive trend. This observation underscores the intricate and finely balanced market sentiment surrounding ICXUSDT.
🌟In summation, with a heightened degree of confidence, it can be projected that the cryptocurrency's price will endeavor to navigate a southward trajectory once more. This projection prompts a vigilant assessment of two critical price zones.
🌟The initial zone, situated around the 61.8% Fibonacci support, near $0.18, signifies a minor demand zone. Additionally, its position within the broader price structure of IMXUSDT marks it as an area where buyers have historically exhibited a propensity for engaging in significant market activity.
🌟Subsequently, the second zone, at approximately $0.15, gains prominence as it aligns with the establishment of a double bottom pattern within the ICON price narrative. This double bottom formation underscores the region's inherent capacity to serve as a robust demand area, historically attracting buyers and fueling market demand.
In closing, the ICXUSDT market offers a nuanced tapestry of resistance levels, supply zones, and historical support regions. Navigating these complexities is essential for traders and investors, as they seek to formulate well-informed strategies within this ever-dynamic crypto landscape.

IMXUSDT's Risk-Reward Potential for Sellers⚪IMXUSDT has demonstrated prolonged respect for the supply zone, affirming the endurance of the long-term downtrend.
⚪This suggests a potential continuation of the price decline.
⚪The current upside pullback, though, presents an appealing risk-reward opportunity for sellers. 📉👀
Trade setup already shared in our channel!

IMX/USDT planning for bullish move? 👀 🚀 IMX Today analysis💎Paradisers, IMXUSDT! We've observed a compelling shift as it breaks free from its descending channel, setting the stage for a potential bullish surge.
💎 For quite some time, IMX has been tracing the contours of a descending channel. However, in the shorter time frame (LTF), it has successfully breached this channel.
💎 We're confident in its potential to embark on a bullish trajectory and challenge the overhead bearish OB. Additionally, its current positioning within the demand zone amplifies the bullish outlook.
💎 However, always be prepared: if the price dips below the pivotal support zone, we might see a pronounced bearish downturn.
💎 Remember to employ prudent trading strategies and use proper stop-loss measures! Stay alert to market movements and look forward to more insight

IMX Next Support & ResistanceIMX Next Support & Resistance
0.436424484
0.557572987
0.669045101
0.744555462
0.845145345
0.957650251

Wait for a breakout | Long BiasChart 1H TF
After pullback and created accumulating phase then bounce back from 0.56
Now, it's trading at 0.587x
If IMX can break and close above Resistance at 0.59 I expect the new bull run for IMX go up to at least 0.64 and higher
Wait and see

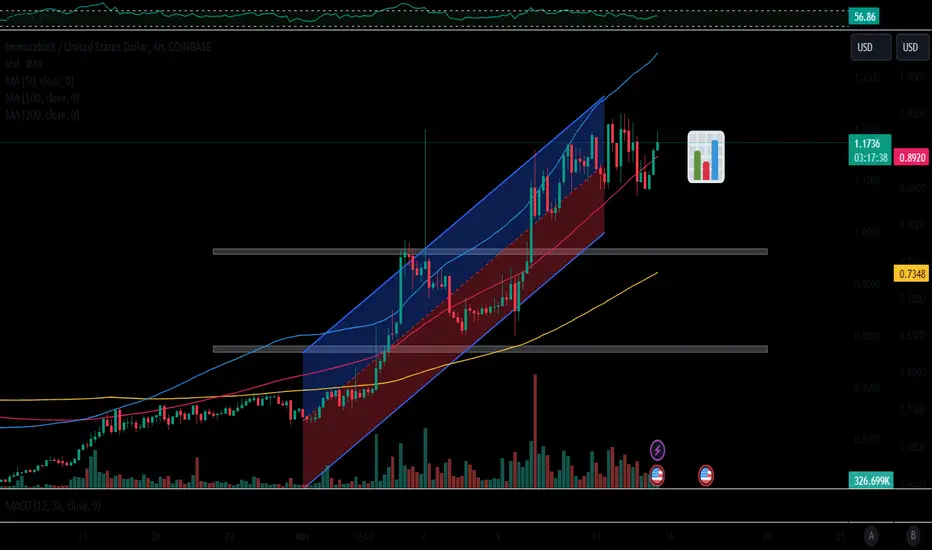
IMXUSDTIMXUSDT is trading in fine bullish trend and maintaining well the bullish trendline.
Whenever the price retest the bullish trendline buyers are attacking aggressively, which can be seen from the chart.
Currently the price is retracing to the inclining trendline and again it is being expected that the bulls are ready to attack.
if bulls take the charge this time too the next target could be 0.6550

Brief Analysis——IMXIMX saw a significant rise last week, but the it turned negative in the following days.
IMX is a token developed by the project Immutable X. Immutable X is a Layer-2 solution built on the Ethereum blockchain, aimed at addressing issues such as high transaction fees and transaction speed delays, especially in the NFT (Non-Fungible Token) space. During the rise in September, the project did not release any good news. The rapid rise in price was mainly driven by the exchange Upbit in South Korean.
We can see the same situation on IMX as previously for many other tokens via the WTA indicator. But this time the whale's action was clearer.
First, in the green rectangle, we can see that whales began to flow into IMX while the price remained volatile. Although the blue column representing the whale is not obvious after being compressed, whales have participated in the transaction for four consecutive days. This is a bottom-buying behavior before pulling up. After that, the long green candle appeared and the price increased by almost 35%. On most other tokens, when whales outflow, participation will decline or even disappear, and price will continue to fluctuate to help whales reap profits. But for IMX, we can clearly see that when the long red candle appears, the blue column does not have disappeared, and whales participate in the transaction, which shows that whales are urgent to close long positions. After such a situation occurs, most gains will be given back in the future.
We can see that IMX has rebounded in recent hours, but on the WTA indicator, only retail investors are participating in transactions. Judging from the performance of whales closing long positions last week, the decline may not be over after losing the support of whales.
Disclaimer: Nothing in the script constitutes investment advice. The script objectively expounded the market situation and should not be construed as an offer to sell or an invitation to buy any cryptocurrencies.
Any decisions made based on the information contained in the script are your sole responsibility. Any investments made or to be made shall be with your independent analyses based on your financial situation and objectives.

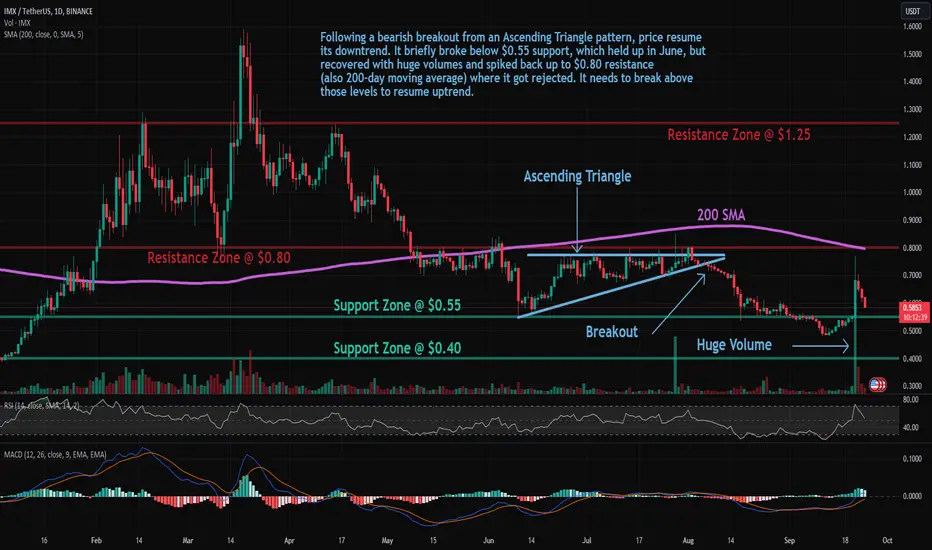
IMX: Approaching SupportTrade setup : Following a bearish breakout from an Ascending Triangle pattern, price resume its downtrend. It briefly broke below $0.55 support, which held up in June, but recovered with huge volumes and spiked back up to $0.80 resistance (also 200-day moving average) where it got rejected. It needs to break above those levels to resume uptrend.
Trend : Uptrend on Short-Term basis and Downtrend on Medium- and Long-Term basis.
Momentum is Mixed as MACD Line is above MACD Signal Line (Bullish) but RSI ~ 50 (Neutral).
Support and Resistance : Nearest Support Zone is $0.55, then $0.40. The nearest Resistance Zone is $0.80, then $1.25.
$imx potential buy TRADECRYPTOCAP:IMX 🎯 pumped and rejected from daily bearish OB
I will be BUY in green zone ( bullish OB ).
