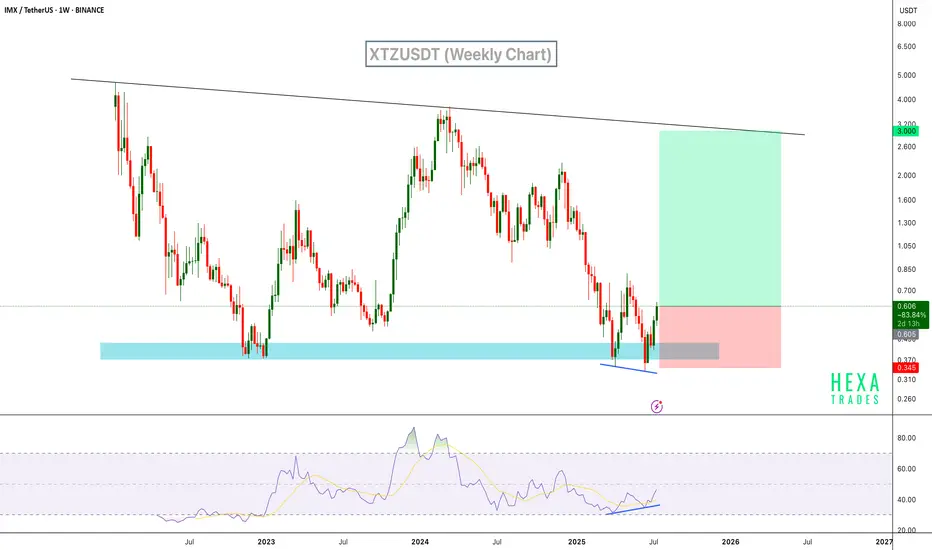
IMX Signals Reversal with RSI Bullish DivergenceIMX has shown a strong bounce from a demand zone, backed by clear bullish divergence on the RSI. Price printed a higher low on the oscillator while price action formed a lower low – a classic reversal signal. This area has acted as support multiple times in the past, and we can expect a reversal from the current support level.
Resistance 1:
Resistance 2:
Resistance 2:
Cheers
Hexa
BINANCE:IMXUSDT CRYPTO:IMXUSD
IMXUSDTPERP
IMXUSDT 6D AnalysisIMX ~ 6D Analysis
#IMX This is the lowest support block for now. Buy if you still have faith in this coin with a short term target of at least 20%+ from this support

IMX - Is it a movie?IMX Looks like a structure is broken for everyone to watch, but the stances is as shown below!!!!!! We can see that the price was building value comfortably above $0.63–$0.65 until May 2nd. Then, a strong selling move broke below that range, followed by a new value area formation below $0.59, showing that sellers are in control and the market is accepting these lower prices. The latest session has POC, VAH, and VAL tightly compressed near $0.563, which means extremely low volatility and a potential setup for the next expansion.
But what i suggest is this, will take a last breather or just go to the next block marked as orange, can have dead cat bounces!!

#IMX/USDT#IMX
The price is moving within a descending channel on the 1-hour frame, adhering well to it, and is heading for a strong breakout and retest.
We are seeing a bounce from the lower boundary of the descending channel, which is support at 0.599.
We have a downtrend on the RSI indicator that is about to be broken and retested, supporting the upward trend.
We are looking for stability above the 100 moving average.
Entry price: 0.602
First target: 0.649
Second target: 0.682
Third target: 0.721

#IMX/USDT#IMX
The price is moving within a descending channel on the 1-hour frame, adhering well to it, and is heading for a strong breakout and retest.
We are seeing a bounce from the lower boundary of the descending channel, which is support at 0.390
We have a downtrend on the RSI indicator that is about to be broken and retested, supporting the upward trend.
We are looking for stability above the 100 moving average.
Entry price: 0.407
First target: 0.426
Second target: 0.449
Third target: 0.480

#IMX/USDT#IMX
The price is moving within a descending channel on the 1-hour frame and is expected to continue upward.
We have a trend to stabilize above the 100 moving average once again.
We have a downtrend on the RSI indicator, which supports the upward move with a breakout.
We have a support area at the lower boundary of the channel at 0.503.
Entry price: 0.0528
First target: 0.540
Second target: 0.560
Third target: 0.587

IMXUSDT 6DIMX ~ 6D Analysis
#IMX The last support that must be maintained. Losing this support will make prices more depressed.

IMXUSDT 6DIMX ~ 6D Analysis
#IMX Buy gradually from here if you still have a Conviction on this coin with a short -term target of at least 20%+.
This is the lowest support block for now.

#IMX/USDT Ready to launch upwards#IMX
The price is moving in a descending channel on the 4-hour frame and sticking to it well
We have a bounce from the lower limit of the descending channel, this support is at 1.30
We have an upward trend on the RSI indicator that is about to be broken, which supports the rise
We have a trend to stabilize above the moving average 100
Entry price 1.46
First target 1.56
Second target 1.64
Third target 1.74

IMX is bullish#IMX has a good pattern for a rise the market has higher prices before and the pattern is perfect this was my last analysis on this coin 👇👇👇

#IMX/USDT Ready to go higher#IMX
The price is moving in a descending channel on the 1-hour frame and sticking to it well
We have a bounce from the lower limit of the descending channel, this support is at 2.00
We have a downtrend on the RSI indicator that is about to break, which supports the rise
We have a trend to stabilize above the moving average 100
Entry price 0.02
First target 2.08
Second target 2.17
Third target 2.29

#IMX/USDT#IMX
The price is moving in a descending channel on the 12-hour frame upwards and is expected to continue.
We have a trend to stabilize above the moving average 100 again.
We have a downtrend on the RSI indicator that supports the rise by breaking it upwards.
We have a support area at the lower limit of the channel at a price of 1.35.
Entry price 1.50.
First target 1.62.
Second target 1.78.
Third target 1.90.

IMXUSDT 1WIMX ~ 1W
#IMX Looks like it has finished completing Wave 5 of its Decline. this would be a very good purchase price by far. with a minimum target of 10-20%

IMX middle term targets Watch this BINANCE:IMXUSDT middle term targets
Spot.
Possible Targets and explanation idea
➡️Weekly global fib levels. Zone (green box) marked in 2022 all zones you knew from last posts 2 years ago. Still relevant and will be relevant
➡️You can track with MP indicator how whales accumulate and distribute position
➡️From 0.38 IMX pumped to 3.70 and we got a 2 main signals to fix profit + RSI bearish div
➡️Now step by step they start accumulate position again. Green box relevant
➡️Tested on W tf fundamental value of token based on Take profit indicator
➡️Middle term target marked by green circle. Potential will be way higher
Hope you enjoyed the content I created, You can support with your likes and comments this idea so more people can watch!
✅Disclaimer: Please be aware of the risks involved in trading. This idea was made for educational purposes only not for financial Investment Purposes.
---
• Look at my ideas about interesting altcoins in the related section down below ↓
• For more ideas please hit "Like" and "Follow"!

IMX updateMX Update
We bought IMX at $1.48.
Currently, it's forming a falling wedge pattern at a major support level, which is a bullish sign. It performed exceptionally well during the last upward trend.
Targets are marked on the chart for reference.
This is a long-term hold position.

IMXUSDT Resistance Zone BreakoutIMXUSDT Technical analysis update
IMX price breaks the resistance zone on the 4H chart after multiple rejections. The 4H candle closed above the resistance zone, and the price is trading above the 100 and 200 EMA. We can expect a strong bullish move from here.
Buy Level: $1.66
Stop Loss: $1.46
Regards
Hexa

IMXUSDT Tripple Bottom!IMXUSDT technical analysis update
IMX has formed a triple bottom on the 4-hour chart, and the price has broken the triple bottom neckline. We can expect a good bullish move from the current level.
Buy Level: $1.33
Stop Loss: $1.20
Regards
Hexa

IMX || Ratio 2.12IMX forming good signals upward.
We mentioned all targets for profit and the risky points,
We are pleased to inform you that we passed the final phases to publish our AIO indicator with Smart strategy.

Is a Head and Shoulders pattern forming on IMX?Hello everyone!
#IMX, I dare to suggest that a head and shoulders technical analysis pattern is forming on the chart.
It can be observed that the price reacts well as it approaches the 0.786 Fibonacci level. In this area, the left shoulder was formed and now the right shoulder may be forming.
The neckline is at a strong Fibonacci level of 0.618. The price potential upon completion of the pattern is around $0.85. However, the decline may be halted by Fibonacci levels of 0.5 - 0.382.

#IMX/USDT#IMX
We have a bearish channel pattern on a 1-hour frame, the price moves within it and adheres to its limits well, and the breakout was made to the upside.
We have a green support area at 2.00
We have a tendency to stabilize above moving average 100
We have a downtrend on the RSI indicator that supports the price higher
Entry price: 2.12
First goal 2.24
The second goal is 2.33
The third goal is 2.43

#IMX/USDT
#IMX
We have a bearish channel pattern on a 4-hour frame, the price moves within it, adheres to its limits well, and is expected to break it upwards in a strong manner.
We have a support area at the lower border of the channel at $1.60 from which the price rebounded
We have a tendency to stabilize above moving average 100
We have an uptrend on the RSI indicator that is about to break higher, supporting the price higher
Entry price is 2.20
The first goal is 2.74
The second goal is 3.18
The third goal is 3.72

IMXUSD 1DIMX ~ 1D
#IMX Make purchases gradually in demand zone or buy after breaking this resistance line, with a minimum target of 15%+

#IMX/USDT#IMX
The price is moving in a head and shoulders pattern on a 4-hour frame,
and we are now at the end of the formation of the right shoulder.
We have stability above Moving Average 100.
We have an uptrend on the RSI indicator that supports the rise and is about to break higher
Entry price is 2.60
The first goal is 2.77
The second goal is 2.91
the third goal is 3.06
the fourth goal is 3.20
