US30 WILL FALL|SHORT|
✅DOW JONES is set to retest a
Strong resistance level above at 41,000
After trading in a local uptrend for some time
Which makes a bearish pullback a likely scenario
With the target being a local support below at 40,000
SHORT🔥
✅Like and subscribe to never miss a new idea!✅
Disclosure: I am part of Trade Nation's Influencer program and receive a monthly fee for using their TradingView charts in my analysis.
Index

SPY Short From Resistance! Sell!
Hello,Traders!
SPY went up again
To retest a wide horizontal
Resistance level of 551.00$
And as the political situation
Remains unstable we are
Bearish biased and we will
Be expecting a local move down
Sell!
Comment and subscribe to help us grow!
Check out other forecasts below too!
Disclosure: I am part of Trade Nation's Influencer program and receive a monthly fee for using their TradingView charts in my analysis.

Price Action: S&P500 SPX Monday 4/14/2025In this video, we are looking at the S&P500 Index and its potential movement on the Daily Chart for Monday 4/14/2025.

DXY at Make-or-Break Level Ahead of Trade Deal UncertaintyGood day Traders,
Take a moment to go through my outlook of DXY.
Currently, DXY is moving within a clearly defined ascending channel, showing a short-term bullish correction after the sharp drop seen last week. Price is respecting the channel's boundaries, making higher highs and higher lows, characteristic of a pullback phase in a broader bearish move.
However, attention is now drawn to the resistance zone around 103.80 – 104.19 zone. This area coincides with:
1. Top of the channel (confluence resistance)
2. A harmonic pattern completion zone or reversal block
3. A previous structural support-turned-resistance area
In my view, the recent price action suggests a potential reversal at or just above this zone, leading to a new bearish leg that could see DXY breaking below the current trend channel and targeting sub-102.56 and 102.00 levels.
From the fundamentals, it appears that optimism around a trade deal is helping the USD recover short-term. The market may be pricing in hope, not reality. If sentiment shifts, or deal details (between US and China) disappoint, a swift reversal is highly likely—aligning with the anticipated turn near 104.00 from the technicals.
I think this makes the current zone a high-alert area for dollar bulls and bears alike. A fake-out to the upside into this supply zone could trap late buyers before the larger macro and technical forces push the dollar back down. By implication, we then expect to see a slight drop then rally on EURUSD, GBPUSD etc.
Cheers and Happy trading!

VIX - Extreme fear in the market: a unique opportunity?Extreme fear in the market: a unique opportunity?
An analysis of the most significant
VIX spikes (1987-2025) and subsequent stock market performance.
The VIX (Volatility Index) is an indicator that reflects the level of fear or uncertainty in the market based on expectations of volatility in the S&P 500 Index.
The VIX's 118% surge from April 4 to April 7, 2025 was the fifth largest 3-day surge in market history.
This surge 🚀 reflects the high level of uncertainty that has developed in the markets.
It is very difficult to make informed investment decisions during such periods.
But we can rely on historical patterns.
After the 20 largest VIX spikes, the S&P 500 Index has consistently delivered exceptional returns:
- After 1 year: 16.5% (vs. 12% in normal periods)
- After 3 years: 45.9% (vs. 39.5% in normal periods)
- After 5 years: 83.0% (vs. 74.4% in normal periods)
The difference in returns over the 4 years is 10.2% above average.
Over the past 40 years, there has only been one negative return (the 2007 spike before the financial crisis), while most extreme fear events have become outstanding buying opportunities. For example, the August 2011 spike was followed by an impressive 117% return over the next five years.
When market panic reaches extreme levels, institutional capital typically steps in against retail sales, setting the stage for stronger long-term growth. History shows that these moments of maximum fear often represent optimal entry points for patient investors.
It is essential to realize that historical patterns do not always hold true in the future. Each crisis has unique characteristics and causes that can lead to different outcomes.
These statistics provide good mathematical expectations, not guarantees.
This has always been the case in the market, and proper handling of math expectations and risk management are the foundations of profitable strategies.
Best regards EXCAVO
_____________________
Disclosure: I am part of Trade Nation's Influencer program and receive a monthly fee for using their TradingView charts in my analysis.

NIKKEI Long From A Massive Support! Buy!
Hello,Traders!
NIKKEI stock index has
Lost almost 27% from the ATH
Which means it is clearly oversold
And the index is about to retest
A massive horizontal support level
Of 30,000 which is a great spot
For going long on the index
And even if the support gets
Broken I would still hold the
Position expecting a rebound
Buy!
Comment and subscribe to help us grow!
Check out other forecasts below too!
Disclosure: I am part of Trade Nation's Influencer program and receive a monthly fee for using their TradingView charts in my analysis.

THE REALITY!You cant beat the Index fund in Long term growth....Compare your portfolio with Major Indices
Warren buffet Quote - You can't Beat S&P500 Index

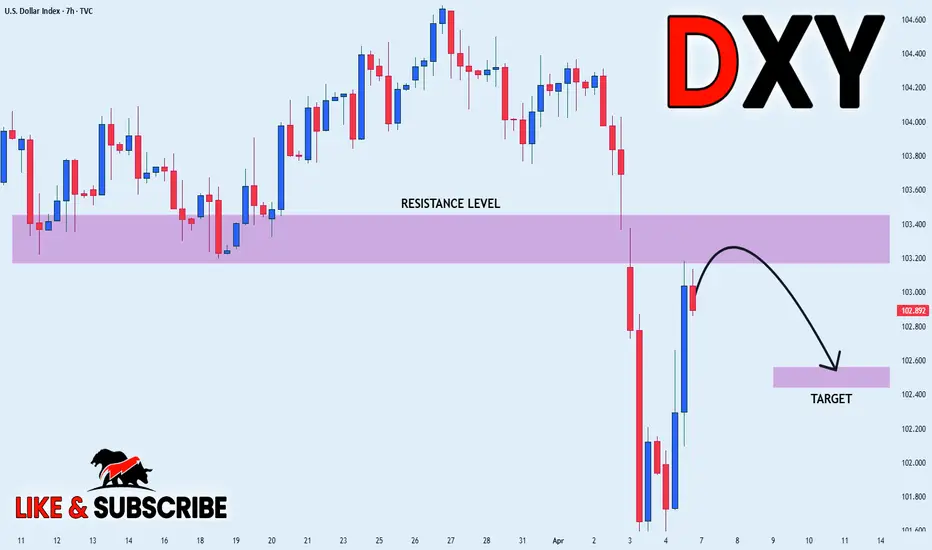
DXY PULLBACK EXPECTED|SHORT|
✅DXY surged again to retest the resistance of 103.400
But it is a strong key level
So I think that there is a high chance
That we will see a bearish pullback and a move down
SHORT🔥
✅Like and subscribe to never miss a new idea!✅
Disclosure: I am part of Trade Nation's Influencer program and receive a monthly fee for using their TradingView charts in my analysis.
DAX Is Oversold! Buy!
Hello,Traders!
DAX fell down sharply
But will soon hit a
Horizontal support level
Of 20,230 and after the
Retest we will be expecting
A strong bullish rebound
Buy!
Comment and subscribe to help us grow!
Check out other forecasts below too!
Disclosure: I am part of Trade Nation's Influencer program and receive a monthly fee for using their TradingView charts in my analysis.
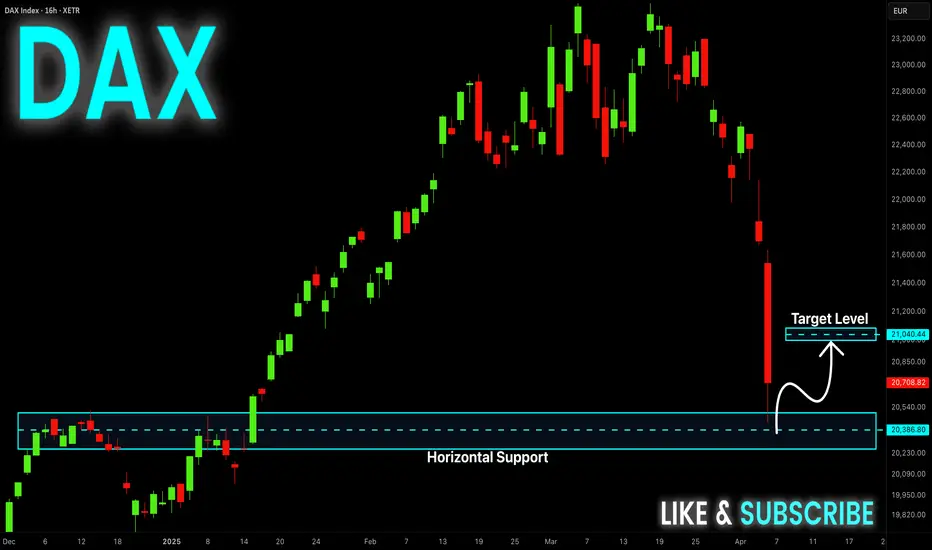
DAX RISKY LONG|
✅DAX is going down to retest
A horizontal support of 20,400
Which makes me locally bullish biased
And I think that we will see a rebound
And a move up from the level
Towards the target above at 20,800
LONG🚀
✅Like and subscribe to never miss a new idea!✅
Disclosure: I am part of Trade Nation's Influencer program and receive a monthly fee for using their TradingView charts in my analysis.

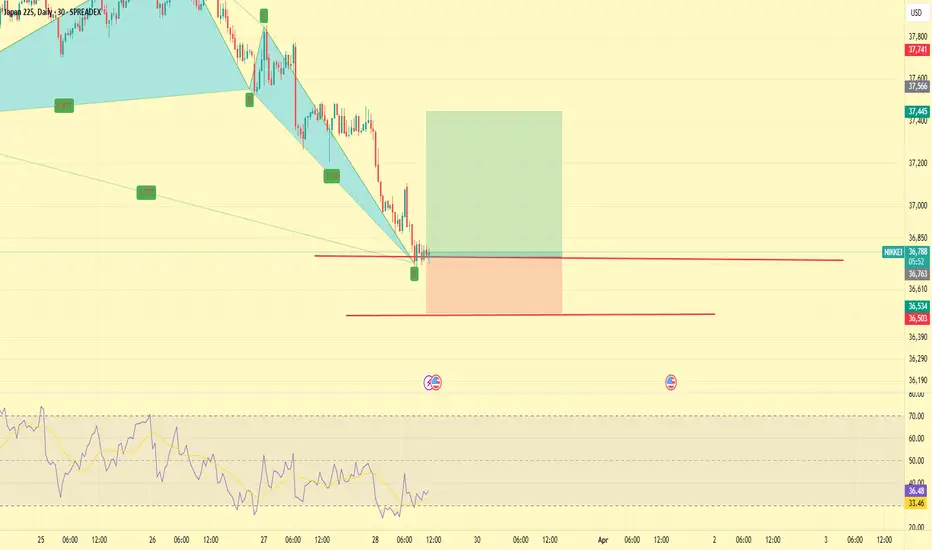
NIKKEI LONG FROM SUPPORT|
✅NIKKEI went down to retest a horizontal support of 35,250
Which makes me locally bullish biased
And I think that a move up
From the level is to be expected
Towards the target above at 36,093
LONG🚀
✅Like and subscribe to never miss a new idea!✅
Disclosure: I am part of Trade Nation's Influencer program and receive a monthly fee for using their TradingView charts in my analysis.

S&P500: Recovery has started and the next stop is the 1D MA50.S&P500 is marginally neutral on its 1D technical outlook (RSI = 45.213, MACD = -61.280, ADX = 30.163) as it's recovered from Friday's bearish sentiment and already crossed above the 0.236 Fibonacci level. This rebound made Monday's low a Double Bottom and since the 1D RSI is on a HL bullish divergence, we expect a strong 1 month rally to start. The first target is the 1D MA50 slightly over the 0.5 Fib mark (TP1 = 5,835) and after a small correction, the 0.786 Fib (TP2 = 6,000), which is also the top of the 5 month Bull Flag.
## If you like our free content follow our profile to get more daily ideas. ##
## Comments and likes are greatly appreciated. ##

SPX500 Long at 55301. All timeframes are massively oversold due to the huge sell-off on Friday night
2. It is the start of the week, and it opened at the low, which tends to mean there would be some strength to go up
3. Unfortunately, I cannot check if there is a harmonic pattern due to technical difficulties.
4. This is at excellent support as it is at the year low
5. There is a lot of divergence due to this not being a long consolidation try to exit at M15 overbought
6. Stop loss below 5500

JPN225 Short 1. This trade is against the trend
2. There are multiple patterns on all timeframes
3. This trade is oversold on all timeframes
4. There is a triple bottom on M15 with divergence
5. 200 Pip stop loss
6. First target at M15 overbought since this is counter trend
DXY Monthly Analysis: Key Support Holding, Bullish Move Ahead?📊 DXY Monthly Chart Analysis (March 27, 2025)
Key Observations:
Current Price Action:
The U.S. Dollar Index (DXY) is trading near 104.267, with notable resistance ahead.
Price is consolidating within a key demand zone (~102.5–104) after rejecting higher levels.
Technical Levels:
Support Zone: 100.2–104 (Highlighted in purple)
Resistance Zone: 112.5–114.7 (Highlighted in purple)
Major Resistance: 114.77 (Previous high, acting as a supply zone)
200-MA Support: Located below current price, offering a long-term bullish confluence.
Market Structure:
Price remains in a higher time-frame bullish trend but is experiencing a correction.
The "BOSS" level (Break of Structure) suggests a prior bullish breakout.
If the demand zone holds, a bullish continuation towards 112.5–114.7 is possible.
Projected Move:
A bounce from 102–104 could trigger a rally toward the upper resistance zone (~112.5).
A break below 100.2 could indicate a shift in trend and further downside.
Conclusion:
DXY is at a critical decision point. Holding the current support zone (~102–104) could fuel a bullish continuation toward 112–114, while a breakdown below 100.2 would weaken bullish momentum.

SP500US Markets has pulled back nicely, It now provides a wonderful opportunity to get back into the market, I expect another drop to take the previous low set couple of days ago. April tends to be a good month for indices as the first quarter closer and rebalancing occured.
my plan would be to buy the SP500 and ride the trend


NIKKEI WILL BE BREAKING OUT SHORTLYAfter consolidating in a bull flag for nearly a year now and is testing it's 20 SMA as support.
Bullis div on the monthly and oversold stochastic rsi. This is and ideal setup!

NIKKEI INDEX BEARISH BIAS|SHORT|
✅NIKKEI is going up now
But a strong resistance level is ahead at 38,400
Thus I am expecting a pullback
And a move down towards the target of 37,530
SHORT🔥
✅Like and subscribe to never miss a new idea!✅
Disclosure: I am part of Trade Nation's Influencer program and receive a monthly fee for using their TradingView charts in my analysis.

Vanguard - “We are the invisible hand of Adam Smith” John BogleIf anyone ever thought of erecting a monument to the person who did the most for American investors — the choice would fall on John Bogle. These words are not from a promotional brochure but a quote from Warren Buffett himself.
Book summary
But most people don’t even know who Bogle is. And certainly don’t realize that he didn’t just “create index funds.” He built an invulnerable power machine disguised as client care.
📈 From a thesis to $10 trillion under management
Bogle’s story begins with an ordinary guy born during the Great Depression. Through poverty, scholarship-based education, and working from age 10 — he makes his way into Princeton, where he writes a thesis on a topic that would change the industry: "mutual funds."
Over the years, his philosophy turned into what we now know as "passive investing." From day one, the Vanguard he created operated on the principle: "maximum benefit to the investor, minimum — to the managers." No fees, no speculation, no marketing. And it worked. But here’s the paradox: ▶ Vanguard gave up profit for the mission.
▶ The world responded — investors were tired of the noise.
▶ As a result — "Vanguard grew into a monster capable of managing the economies of entire nations."
🧠 A revolutionary idea: a fund owned by investors
Bogle built a structure where "the fund owners are the investors themselves."
Sounds beautiful: no shareholders, no profit pressure — only long-term client interests. But then who de facto manages these trillions?
⚠️ Vanguard is not a public company.
⚠️ Its shares are not traded.
⚠️ The real ownership mechanism — a black box.
It’s the perfect system for... "invisible control." And this isn’t a conspiracy theory, but logic:
If you can’t find the ultimate beneficiary — it means they’re either too big, or hiding for a reason.
🕸️ The “Big Three” and the invisible hand effect
Vanguard, BlackRock, and State Street — three funds that hold between 3% to 8% of shares in most of the world’s largest corporations. It seems small, but only 15–20% of shares are in free float.
❗ This gives the Big Three “real power”: from voting at meetings to influencing media narratives and climate policy.
📌 They own stakes in CNN, Fox, and Disney.
📌 Invest in oil companies that violate human rights.
📌 And at the same time — push the “green transition” agenda.
Conflict of interest? No. It’s “total control over both sides of the conflict.”
🤫 Why Vanguard is impossible to destroy
If you think Vanguard is just an investment fund, here are a few facts:
🔒 No company shares → can’t buy a controlling stake.
🔒 Over 400 legal entities → can’t file a single lawsuit.
🔒 Every investor essentially becomes a “co-owner” → responsibility is blurred.
🔒 All stakes split below 10% → bypass antitrust laws.
You can’t sue a ghost.
You can’t attack a network if you don’t know where its center is.
🧭 What’s next?
Today, Vanguard manages over $10 trillion, which is more than the GDP of Germany, India, and Brazil combined.
Though the fund’s founder passed away as “the conscience of Wall Street,” his creation became an "architecture of global control" that even the U.S. Federal Reserve couldn’t handle.
🎤 “We are the invisible hand of Adam Smith,” John Bogle once said.
A more detailed book review will follow below. I understand how important this is in our time and I appreciate it.
📘 General Concept of the Book:
The book is at once the autobiography of John Bogle, the story of the founding and development of Vanguard, and a manifesto of index investing philosophy. A runaway waiter, Princeton graduate, and "Wall Street rebel," Bogle creates Vanguard — a company that changed the investment world by making it more fair and accessible.
📑 Structure of the Book:
The book is divided into four parts:
Part I — The History of Vanguard.
Part II — The Evolution of Key Funds.
Part III — The Future of Investment Management.
Part IV — Personal Reflections, Philosophy, and Values of the Author.
💡 Key Ideas of the Book (Introductory Chapters, Preface):
- Index investing is the most important financial innovation of the 20th century.
- Passive management beats active managers in returns and costs.
- Vanguard’s mission is not to make money off investors, but to serve them.
- Criticism of Wall Street: high fees, conflicts of interest, short-term thinking.
- Financial revolution — a mass shift of investors from active to index funds.
🧠 Bogle's Values:
- Long-term thinking. Don’t give in to market “noise.”
- Honesty and transparency in investing.
- Minimal costs = maximum return for the investor.
- Fiduciary duty: protecting the client’s interest comes first.
📗 Part I: The History of Vanguard
🔹 Chapter 1: 1974 — The Prophecy
Context:
John Bogle is in a difficult position — he’s fired as head of Wellington Management Company.
During a trip to Los Angeles, he meets John Lovelace of American Funds, who warns: if you create a truly mutual investment company, you’ll destroy the industry.
Main Idea:
⚡ Bogle decides to go against the profit-driven industry and creates Vanguard — a company owned by investors, not managers.
Key Moments:
- Vanguard is founded in 1974 — in the middle of a crisis.
- The company has no external shareholders — all “profits” are returned to investors through lower fees.
- In 1975, the first index fund for individual investors is launched — a revolutionary idea, initially ridiculed as “Bogle’s madness.”
Important Quotes:
"Gross return before costs is market return. Net return after costs is lower. Therefore, to get the maximum, you must minimize costs."
– Bogle’s fundamental rule
🔹 Chapter 2: 1945–1965 — Background: Blair Academy, Princeton, Fortune, and Wellington
Early Life:
Bogle studies at Blair Academy on a scholarship, works as a waiter.
He enters Princeton. Struggles with his economics course, but…
In the library, he accidentally finds the Fortune article “Big Money in Boston” — about mutual funds.
Turning Point:
This article inspires Bogle to write his thesis:
“The Economic Role of the Investment Company”, where he argues:
- Funds should work for investors;
- Don’t expect them to beat the market;
- Costs must be minimized;
- Fund structure must be fair and transparent.
Career Start:
Work at Wellington Management (Philadelphia).
Starts from scratch, rising from junior analyst to president of the company.
Under Walter Morgan’s leadership, he learns the principles of discipline and serving investors.
✍️ Interim Summary
What’s important from these early chapters:
- Vanguard was born from the ruins of Bogle’s former career — an example of how failure can be the beginning of greatness.
- Already in college, Bogle saw the issue of conflicts of interest in the industry.
- His philosophy is idealism in action: don’t play guessing games — just invest in the market and reduce costs.
📘 Chapter 3: 1965–1974 — Rise and Fall
🚀 Appointed President of Wellington Management:
In 1965, at just 35 years old, John Bogle becomes president of Wellington.
He decides to modernize the business and bring in young star managers from Wall Street, especially from the firm Thorndike, Doran, Paine & Lewis.
⚠️ Risky Alliance:
Bogle makes a fatal mistake — he merges with the new management company without ensuring value alignment.
The new partners are focused on profit and short-term gains, not building a strong long-term foundation.
This leads to internal conflict, loss of trust, and poor fund performance.
💥 Dismissal:
In 1974, after a series of conflicts, the board removes Bogle.
He loses control of the company he built for nearly 25 years.
Bogle’s comment:
"I was fired, but I was still chairman of the Wellington mutual funds — and that turned out to be a lifeline."
📘 Chapter 4: 1974–1975 — The Birth of Vanguard
🧩 A Unique Legal Loophole:
Though Bogle was fired from the management company, he remained head of the Wellington Fund trustees — giving him the opportunity to build a new independent structure.
🛠 Creating Vanguard:
In December 1974, he launches The Vanguard Group — a company owned by the investors (shareholders) themselves.
Model: the fund belongs to the investors → the fund owns the management company → no outside profit, only cost recovery.
⚙️ "Vanguard" as a Symbol:
The name was inspired by Admiral Horatio Nelson’s ship — HMS Vanguard.
A symbol of leadership, courage, and moving against the tide.
Key Idea:
Vanguard would be the only truly mutual investment organization — a model where clients = owners.
📘 Chapter 5: 1975 — The First Index Fund
🤯 Revolution: The Indexing Approach
Bogle decides to create the first index mutual fund for retail investors.
Name: First Index Investment Trust (later — Vanguard 500 Index Fund).
Idea: invest in all S&P 500 stocks to reflect the market’s return instead of trying to beat it.
🪓 A Blow to the Industry:
The financial world reacts harshly:
- “Bogle’s madness”;
- “This is a failure”;
- “Who would want to just match the market?”
🔧 Humble Beginning:
The goal was to raise $150 million, but only $11 million was collected — tiny by industry standards.
But Bogle didn’t give up:
"It was a small step, but with a powerful message."
💡 Summary of Chapters 3–5: How Vanguard Was Built
🔑 Event 💬 Meaning
Loss of control at Wellington ----- Collapse of the old model, beginning of a new path
Creation of Vanguard------------- Innovative, investor-first structure
Launch of index fund--------------Start of the indexing revolution, Bogle’s core philosophy
📝 Quotes for Thought:
"All I did was apply common sense. I just said: Let’s leave the returns to the investors, not the managers." — John Bogle
"This is a business where you get what you don’t pay for. Lower costs = better results." — Bogle’s favorite saying, debunking “more is better”
📘 Chapter 6: 1976–1981 — The Survival Period
⏳ Tough Start:
After launching the index fund, Vanguard faces slow growth and constant skepticism.
For 83 straight months (nearly 7 years!), Vanguard sees net outflows — investors are hesitant to trust this new model.
🧱 Laying the Foundation:
Bogle and his team focus on:
- Transparency
- Lowering costs
- Investor education (they explain what it means to “stay the course”)
💬 The Core Dilemma:
"All investors want to beat the market. But no one wants to pay the price: high fees, taxes, risks. We offered an alternative — reliability, simplicity, and low cost."
📈 Small Wins:
Despite modest volume, Vanguard starts building a reputation as an “honest player.”
It becomes evident: investors using Vanguard achieve better long-term results than those chasing trendy funds.
📘 Chapter 7: 1982–1991 — Growth and Recognition
💡 The Power of Philosophy:
Bogle keeps repeating: “Stay the course” — don’t try to predict the market, don’t fall for fear and greed.
This message becomes especially powerful after the 1982 and 1987 market crises.
🏆 The First Fruits:
A slow but steady increase in assets begins.
Vanguard launches new index funds:
- Total Stock Market Index
- Bond Index
- International Index
📣 Educational Mission:
Bogle writes books, articles, gives interviews.
He isn’t just running a fund — he’s changing how people think about investing.
A community of followers emerges — the Bogleheads.
📊 Key Stats:
By 1991, Vanguard's assets reach around $130 billion.
Index funds begin receiving positive reviews from analysts, including Morningstar.
📘 Chapter 8: 1991–1999 — Industry Leadership
🚀 Explosive Growth:
In the 1990s, index funds go mainstream.
Investors realize that most active funds underperform the market — and they vote with their money for Vanguard.
🧰 Expanding the Product Line:
Vanguard introduces:
- Retirement funds
- Bond funds
- International and balanced funds
- Admiral Shares — low-cost funds for loyal investors
📢 Open Fight with the Industry:
Bogle continues to harshly criticize Wall Street:
- For greed, manipulation, and lack of transparency
- For prioritizing company profit over client interest
"The industry hates Vanguard because it proves you can be honest and still succeed."
⚠️ Internal Challenges:
In the late 1990s, Bogle’s health declines.
He passes leadership to Jack Brennan but retains influence on company strategy.
📊 Midpoint Summary (Chapters 6–8)
📅 Phase 📈 Essence
1976–1981 Quiet survival: building the model, fighting for trust
1982–1991 Slow growth: philosophy attracts investors
1991–1999 Recognition and leadership: indexing becomes dominant
💬 Bogle Quotes from These Chapters:
"Investing is not a business. It’s a service. Those who forget this lose everything."
"Every dollar spent on fees is a dollar lost to your future."
"Volatility is not the enemy. The real enemy is you, if you panic."
📘 Chapter 9: Leadership as a Calling
💡 A Leader ≠ A Manager:
Bogle contrasts a true leader with just an efficient executive.
A real leader:
- Puts others’ interests above their own
- Has a moral compass, not just KPIs
- Makes hard, unpopular decisions
🛤 His Leadership Style:
"Don’t ask others to do what you wouldn’t do yourself."
"Always explain why — people follow meaning, not orders."
He genuinely believes Vanguard should be more than a successful business — it should be a force for good in the market.
"Leadership is loyalty to an idea bigger than yourself."
🔄 Feedback Principle:
Bogle constantly interacts with clients, employees, and journalists.
He never isolates himself in an “ivory tower” — he believes this openness is a leader’s true strength.
📘 Chapter 10: Client Service — Vanguard’s Mission
🧭 The Mission:
"Maximize investor returns — not company profits."
Vanguard is built around fiduciary responsibility: every decision must pass the test — is this in the investor’s best interest or not?
🧾 How It’s Implemented:
- Fees below market average → investors keep more
- No ads for “hot” funds → Vanguard sells stability, not trends
- No sales commissions → no one profits off pushing funds to clients
- Ethical code — “Don’t do anything you wouldn’t want on the front page of the newspaper.”
"We’re not trying to be the best for Wall Street. We’re trying to be the best for you."
📘 Chapter 11: The Market Should Serve Society
📉 Critique of Modern Wall Street:
Bogle argues that finance has drifted from its original purpose.
Investing has turned into trading.
The investor became a cash cow, not a partner.
"The market now serves itself — and we’re still paying the price."
🌱 What the System Should Look Like:
- Companies should serve society
- Investors should be owners, not speculators
- Funds should be transparent, accountable, and honest
📢 Call for Reform:
Bogle calls for a rethinking of finance:
- Restore the human element
- Make mission more important than profit
- Protect long-term interests of millions of ordinary investors
"If we want capitalism with a human face, we must return finance to serving society."
📊 Summary of Chapters 9–11: Bogle's Philosophy
📌 Direction------------💬 Essence
Leadership-------------Morality, leading by example, purpose-driven
Business---------------First and foremost — service to the client
Financial System-------Must work for society, not just for profit of the few
✨ Inspirational Quotes:
"The most important thing you can invest is not money — it’s your conscience."
"Honesty in business is not a competitive edge. It’s a duty."
"I’m not against capitalism. I’m against capitalism without morals."
📘 Chapter 12: The Future of Investing — Where the Industry Is Headed
🌐 Bogle sees three main trends:
Victory of Passive Investing:
- Index funds continue to displace active management
- Their share of assets under management is growing rapidly
- More investors are realizing the power of simplicity
Fee Pressure:
- Fees are approaching zero (some funds are effectively free)
- Winners: investors. Losers: traditional management companies
The Role of Technology:
- Rise of robo-advisors (automated investment advisors)
- But Bogle warns: Technology without philosophy is just a tool, not a solution
🚨 Threat #1 — Hyperfinancialization:
"The market is turning into a casino. And the fewer the players, the more the house wins."
Bogle reminds us: the goal of investing is owning businesses — not gambling.
The higher the turnover, the more you lose on fees and taxes.
📘 Chapter 13: The Power of Indexing — Threat or Blessing?
📈 Strength in Scale:
The biggest index providers (Vanguard, BlackRock, State Street) own large shares in nearly all companies in the indexes.
This raises the issue of concentrated power — is too much influence in too few hands?
⚖️ The Indexing Paradox:
Index funds don’t actively vote on corporate governance issues.
So the more power they hold, the less oversight there is over company management.
📣 Bogle’s Proposals:
- Establish a code of conduct for index providers
- Require them to vote in investors’ interests
- Mandate transparency in how they use their voting power
"We fought for the democratization of investing. We cannot let it end in a new monarchy."
📘 Chapter 14: Personal Reflections — On Life, Mission, and Faith
🧬 Personal and Eternal:
Bogle shares his core life principles:
- To serve, not to own
- To leave a mark, not accumulate
- To do what’s right, not what’s profitable
He talks about his battle with heart disease — both as a personal journey and a metaphor for resisting the system.
🙏 Gratitude:
He dedicates the book to his family, colleagues, and investors.
Emphasizes: every day is a chance to be useful.
"I created Vanguard, but Vanguard created me. My career isn’t a triumph — it’s a thank you to fate for the chance to be heard."
📊 Summary of Chapters 12–14: Looking Ahead and Within
📌 Theme-----------------💬 Essence
Future of Investing---------Indexing is the new standard, but needs responsible stewardship
Concentration of Power----Index giants must be accountable to society
Personal Legacy-----------Life is about service, honesty, and setting an example
💬 Final Inspirational Quotes:
"Life isn’t about making more money. It’s about doing more good."
"One day, someone will say: ‘Bogle was stubborn. He never compromised his conscience.’ That will be the best reward."
🧩 Bogle’s Principle Summary (from the book):
- Lower costs — pay less = keep more
- Don’t chase returns — be realistic
- Be a long-term investor — ignore market noise
- Invest broadly, passively, regularly
- Don’t try to beat the market — own the market
- Focus on goals, not trends
- Finance = service. Not a business for profit
💡 Investment Philosophy
🟨 “This is a business where you get what you don’t pay for.”
🟨 “Don’t try to beat the market. Just own it.”
🟨 “In the stock market, investors are rewarded for patience and punished for frenzy.”
🟨 “Gross return minus costs = market return. After costs — less. So: reduce costs — and you win.”
🟨 “The problem isn’t that investors know too little. The problem is they know too much of what doesn’t matter.”
🧭 Principles & Morality
🟩 “Investing is not a business. It’s a service.”
🟩 “Honesty isn’t a strategy. It’s an obligation.”
🟩 “The goal of Vanguard isn’t to make more, but to return to the investor what’s rightfully theirs.”
🟩 “If your investments keep you up at night, change them. Or better — change yourself.”
🧠 On Leadership and Mission
🔷 “A leader isn’t the one in front. It’s the one responsible for the rest.”
🔷 “Respect isn’t bought. It’s earned when you do what’s right, even if it’s unpopular.”
🔷 “We didn’t build Vanguard for glory. We built it to leave something better than what was.”
💬 On the Market and Industry
🔴 “Today's stock market isn’t a place for investors. It’s a casino with a shiny sign.”
🔴 “We’re not against capital. We’re against capitalism without a conscience.”
🔴 “The people selling investments always say they can pick the best. But what if the best is just paying less?”
❤️ On Life and Legacy
💠 “I created Vanguard, but Vanguard created me. It’s not my victory — it’s gratitude for the chance to serve.”
💠 “Every day is a chance to do something not for yourself.”
💠 “You can measure success with money. Or with a conscience, you don’t have to justify.”
It was a lot of work!
Click to like + Write in the comments your favorite books about the financial market
Best regards, EXCAVO
_____________________
Disclosure: I am part of Trade Nation's Influencer program and receive a monthly fee for using their TradingView charts in my analysis.

Nasdaq - The Most Decisive Point Ever!Nasdaq ( TVC:NDQ ) might break below all structure:
Click chart above to see the detailed analysis👆🏻
After breaking above the major channel resistance trendline just a couple of months ago, the Nasdaq is now being dominated by bears and starting to break everything back to the downside. So far we didn't see any confirmation but the next couple of days will decide just everything.
Levels to watch: $20.000, $16.000
Keep your long term vision,
Philip (BasicTrading)

SPX us500The index has a target price range of 5991, there is a possibility of going up from this moment, but another possibility is that the range of 5520 will be touched and then it will move up.

$GBINTR - U.K Interest Rates (March/2025)ECONOMICS:GBINTR
March/2025
source: Bank of England
- The Bank of England voted 8-1 to keep the Bank Rate at 4.5% during its March meeting,
as policymakers adopted a wait-and-see approach amid stubbornly high inflation and global economic uncertainties. The bank highlighted that, given the medium-term inflation outlook, a gradual and cautious approach to further withdrawal of monetary policy restraint remains appropriate.
CPI inflation increased to 3.0% in January, and while global energy prices fell,
inflation is expected to rise to 3¾% by Q3 2025.
Also, the MPC noted that global trade policy uncertainties and geopolitical risks increased, with financial market volatility rising. source: Bank of England
