SPX Fractal Expansion: New Highs Ahead Despite FearAs of April 14, 2025, the CBOE:SPX is exhibiting a clear fractal expansion, suggesting the beginning of a new bullish leg. The recent correction, which caused widespread panic, appears to have completed a fractal cycle reset, with price respecting historical support near 4704 and forming a new fractal edge around 5300.
Despite the fear-driven selloff, momentum indicators like RSI and MACD show signs of bottoming, and volume surged on rebound days, confirming strong institutional buying. The price is now testing temporary resistance at 5878, with a path open to reclaim all-time highs (6100+).
Global & Technical Tailwinds
Technical momentum is recovering across timeframes, with positive divergence on stochastic oscillators.
Breadth is improving: More stocks are participating in the rally, reflecting internal strength.
Sentiment has flipped: The VIX has cooled from panic levels (above 45), and investor fear is easing.
Macro support: Inflation is declining, and central banks are signaling potential rate cuts by late 2025.
Earnings outlook remains solid, and analysts forecast SPX to end 2025 around 6500–7100.
🔍Conclusion
The SPX is carving out a fractal mirror of past bullish reversals, reinforced by strong macro and technical context. Barring unexpected shocks, the index is likely to break above resistance and push toward new highs, even as residual fear lingers. The setup favors buying dips within this emerging structure.
Indexes
ES where?📉 ES1! - S&P 500 E-mini Futures (Daily)
We’re approaching a critical point on the long-term trendline.
🟠 Price has bounced sharply after a steep pullback, reacting right at the dynamic support that’s held since the 2022 lows.
🟢 Two possible scenarios:
Bullish Continuation: support holds, the index regains momentum and pushes back toward the highs.
Bearish Breakdown: trendline breaks, signaling a potential structural shift with downside targets possibly below 4000.
📊 Momentum indicator is in extreme territory → wait for confirmation, don’t anticipate.
AAPL About to CRACK!Without Question, AAPL is the best company in the world and the most valuable. However, it means little in this economic landscape.
AAPL is about to start cracking here. I usually do not post them ahead like this, but in this situation, I will break my own rules.
Take your money and RUN!!!
WARNING!! GTFO!
DOW JONES INDEX (US30): Detailed Support & Resistance Analysis
Here is my latest structure analysis for US30 Index.
Resistance 1: 40650 - 40850 area
Resistance 2: 41150 - 41300 area
Resistance 3: 42550 - 42850 area
Support 1: 40000 - 40250 area
Support 2: 39470 - 39650 area
Support 3: 38400 - 38650 area
Consider these structures for pullback/breakout trading.
❤️Please, support my work with like, thank you!❤️
I am part of Trade Nation's Influencer program and receive a monthly fee for using their TradingView charts in my analysis.
DOLLAR INDEX (DXY): Long-Awaited Recover
It looks like Dollar Index is going to pullback
after a test of a significant support cluster on a daily.
A strong bullish imbalance candle that was formed on an hourly
time frame shows a strong buying interest from that zone.
I expect a bullish movement at least to 102.35
❤️Please, support my work with like, thank you!❤️
NASDAQ INDEX (US100): Bullish Reversal Confirmed?!
I see 2 very strong bullish reversal confirmation on US100 on a daily.
First the market violated a resistance line of a falling channel.
Then, a neckline of a cup & handle pattern was broken.
Both breakouts indicate the strength of the buyers.
We can expect a growth at least to 20300 resistance.
❤️Please, support my work with like, thank you!❤️
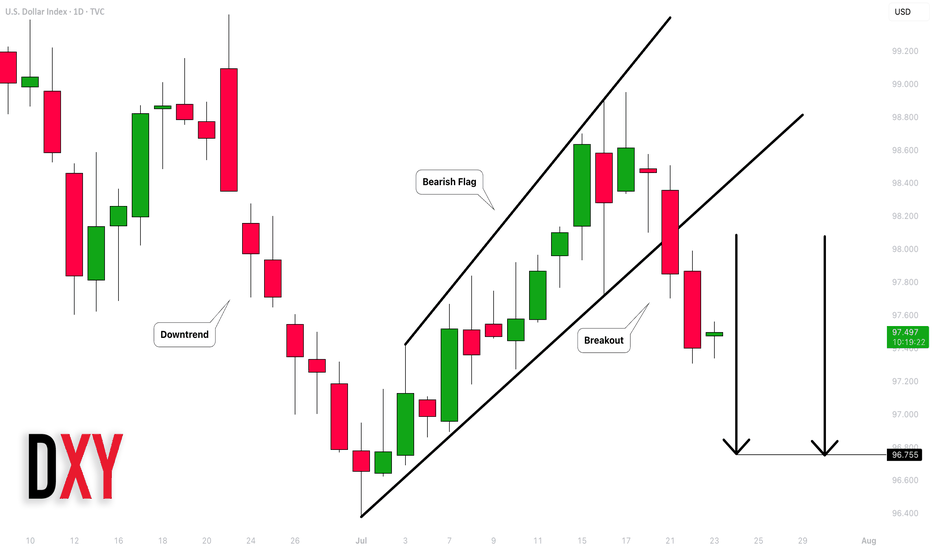
DOLLAR INDEX (DXY): Strong Bullish Sentiment
As I predicted yesterday, Dollar Index continued growing.
Analyzing the intraday price action today,
we can see that the market established a nice rising channel on a 4H.
I think that the Index will keep rising within a channel and will reach 105.0 level soon.
❤️Please, support my work with like, thank you!❤️
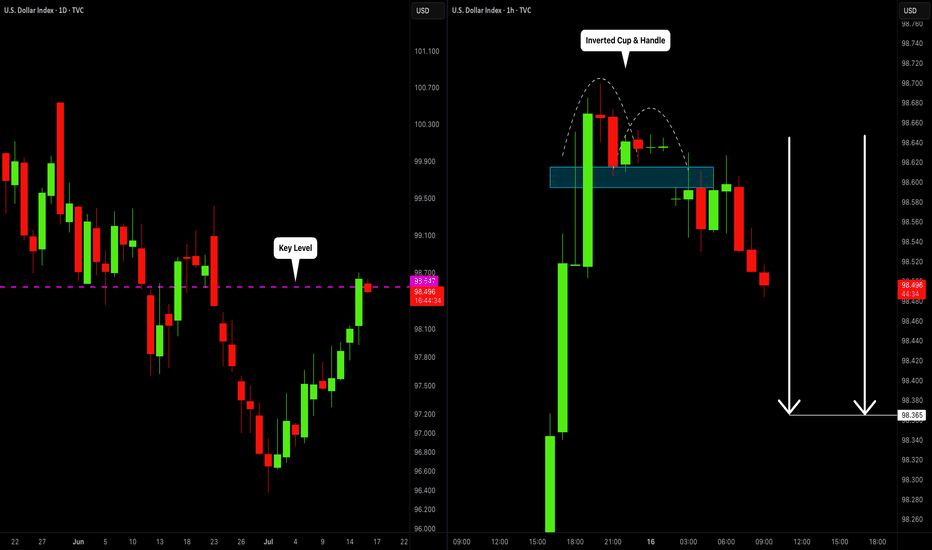
$GBIRYY -U.K Inflation Rate (February/2025)ECONOMICS:GBIRYY
February/2025
source: Office for National Statistics
- The annual inflation rate in the UK fell to 2.8% in February 2025 from 3% in January, below market expectations of 2.9%, though in line with the Bank of England's forecast.
The largest downward contribution came from prices of clothing which declined for the first time since October 2021 (-0.6% vs 1.8%), led by garments for women and children's clothing.
Inflation also eased in recreation and culture (3.4% vs. 3.8%), particularly in live music admission and recording media, as well as in housing and utilities (1.9% vs. 2.1%), including actual rents for housing (7.4% vs. 7.8%).
In contrast, food inflation was unchanged at 3.3% and prices rose faster for transport (1.8% vs 1.7%) and restaurants and hotels (3.4% vs 3.3%).
Meanwhile, services inflation held steady at 5%.
The annual core inflation rate declined to 3.5% from 3.7%.
Compared to the previous month, the CPI increased 0.4%, rebounding from a 0.1% decline but falling short of the expected 0.5% increase.
DOLLAR INDEX (DXY): Time to Recover
I see a confirmed bullish reversal on Dollar Index
initiated after a test of a key daily horizontal support.
A formation of a double bottom pattern on that and a consequent
violation of its neckline provides a strong bullish signal.
I think that the index will reach at least 105.0 level soon.
❤️Please, support my work with like, thank you!❤️
DOLLAR INDEX (DXY): Bearish Outlook Explained
Dollar Index is currently consolidating within a range on intraday time frames.
Testing its upper boundary, the market formed a double top pattern.
With a strong bearish mood after the opening, the market is going
to drop lower.
Goal - 103.8
❤️Please, support my work with like, thank you!❤️
$USINTR - U.S Interest Rates (March/2025)ECONOMICS:USINTR
March/2025
source: Federal Reserve
- The Fed keep the funds rate unchanged at 4.25%-4.5%,
but signaled expectations of slower economic growth and rising inflation.
The statement also noted that uncertainty around the economic outlook has increased, but officials still anticipate only two quarter-point rate reductions in 2025.
DOW JONES INDEX (US30): Pullback From Resistance
Dow Jones Index looks bearish after a test of a key daily/intraday resistance.
An inverted cup & handle pattern on that on an hourly and a strong
intraday bearish momentum this morning leaves clear bearish clues.
I think that the market can retrace at least to 41580 support.
❤️Please, support my work with like, thank you!❤️
Dollar Index (DXY): Bullish Reversal is Coming?!
Dollar Index is stuck on a key daily horizontal support.
Analyzing the intraday time frames, I spotted an inverted head & shoulders
pattern on a 4H.
Its neckline breakout will be an important event that will signify a bullish reversal.
The index will continue recovering then.
Alternatively, a bearish breakout of the underlined blue support
will push the prices lower.
❤️Please, support my work with like, thank you!❤️
S&P500 INDEX (US500): More Down
With a confirmed bearish breakout of a key daily horizontal support,
US500 index opens a potential for more drop.
Next key support is 5425.
It looks like the market is going to reach that soon.
❤️Please, support my work with like, thank you!❤️
I am part of Trade Nation's Influencer program and receive a monthly fee for using their TradingView charts in my analysis.
Index Investing: A Practical Approach to Market ParticipationIndex Investing: A Practical Approach to Market Participation
Index investing has become a popular way for traders and investors to access the broader market. By tracking the performance of financial indices like the S&P 500 or FTSE 100, index investing offers diversification, lower costs, and steady exposure to market trends. This article explores how index investing works, its advantages, potential risks, and strategies to suit different goals.
Index Investing Definition
Index investing is a strategy where traders and investors focus on tracking the performance of a specific financial market index, such as the FTSE 100 or S&P 500. These indices represent a collection of stocks or other assets, grouped to reflect a segment of the market. Instead of picking individual assets, index investors aim to match the returns of the entire index by investing in a fund that mirrors its composition.
For example, if an investor puts money in a fund tracking the Nasdaq-100, it’s effectively spread across all companies in that index, including tech giants like Apple or Microsoft. This approach provides instant diversification, as the investor is not reliant on the performance of a single stock.
This style of investing is often seen as a straightforward way to gain exposure to broad market trends without the need for active stock picking. Many investors choose exchange-traded funds (ETFs) for this purpose, as they trade on stock exchanges like individual shares and often come with lower fees compared to actively managed funds.
How Index Investing Works
Indices are constructed by grouping a selection of assets—usually stocks—to represent a specific market or sector. For instance, the S&P 500 includes 500 large-cap US companies, weighted by their market capitalisation. This means larger companies like Apple and Amazon have a greater impact on the index performance than smaller firms. The same principle applies to indices like the FTSE 100, which represents the 100 largest companies listed on the London Stock Exchange.
Index funds aim to mirror the performance of these indices. Fund managers have two primary methods for this: direct replication and synthetic replication. With direct replication, the fund buys and holds every asset in the market, matching their exact proportions. For example, a fund tracking the Nasdaq-100 would hold shares of all 100 companies in that index.
Synthetic replication, on the other hand, uses derivatives like swaps to mimic the index's returns without directly holding the assets. This method can reduce costs but introduces counterparty risk, as it relies on financial agreements with third parties.
Because index investing doesn’t involve constant buying and selling of assets, funds typically have lower management fees compared to actively managed portfolios. Fund managers don’t need to research individual stocks or adjust holdings frequently, making this a cost-efficient option for gaining exposure to broad market trends.
Advantages and Disadvantages of Index Investing
Index investing has become a popular choice for those looking for a straightforward way to align their portfolios with market performance. However, while it offers some clear advantages, there are also limitations worth considering. Let’s break it down:
Advantages
- Diversification: By investing in an index fund, investors gain exposure to a broad range of assets, reducing the impact of poor performance from any single stock. For instance, tracking the S&P 500 spreads investments across 500 companies.
- Cost-Efficiency: Index funds often have lower fees compared to actively managed funds because they require less trading and oversight. Passive management keeps costs low, which can lead to higher net returns over time.
- Transparency: Indices are publicly listed, so investors always know which assets they are invested in and how those assets are weighted.
- Consistent Market Exposure: These funds aim to match the performance of the market segment they track, providing reliable exposure to its overall trends.
- Accessibility: As exchange-traded funds (ETFs) are traded on stock exchanges, this allows investors to buy into large markets with the same simplicity as purchasing a single stock.
Disadvantages
- Limited Flexibility: Index funds strictly follow the composition of the underlying assets, meaning they can’t respond to other market opportunities or avoid underperforming sectors.
- Market Risk: Since these funds mirror the broader market, they’re fully exposed to downturns. If the market drops, so will the fund’s value.
- Tracking Errors: Some funds may not perfectly replicate an index due to fees or slight differences in holdings, which can cause performance to deviate.
- Lack of Customisation: Broad-based investing doesn’t allow for personalisation based on individual preferences or ethical considerations.
Index Investing Strategies
Index investing isn’t just about buying a fund and waiting—an index investment strategy can be tailored to suit different goals and market conditions. Here are some of the most common strategies investors use:
Buy-and-Hold
This long-term index investing strategy involves purchasing an index fund and holding it for years, potentially decades. The aim is to capture overall market growth over time, which has historically trended upwards. This strategy works well for those who value simplicity and are focused on building wealth gradually.
Sector Rotation
Some investors focus on specific sectors within indices, such as technology or healthcare, depending on economic trends. This strategy can help take advantage of sectors expected to outperform while avoiding less promising areas. For instance, in periods of economic downturn, investors might allocate funds to the MSCI Consumer Staples Index, given consumer staples’ defensive nature.
Dollar-Cost Averaging (DCA)
Rather than investing a lump sum, this index fund investing strategy involves putting money away regularly—say monthly—into indices, regardless of market performance. DCA reduces the impact of market volatility by spreading purchases over time.
The Boglehead Three-Fund Index Portfolio
Inspired by Vanguard founder John Bogle, this strategy is a popular approach for simplicity and diversification. It involves splitting index investments across three areas: a domestic stock fund, an international stock fund, and a bond fund. This mix provides broad market exposure and balances growth with risk. According to theory, the strategy is cost-efficient and adaptable to individual risk tolerance, making it a favourite among long-term index investors.
Hedging with Index CFDs
Traders looking for potential shorter-term opportunities might use index CFDs to hedge against broader market movements or amplify their exposure to a specific trend. With CFDs, traders can go long or short, depending on their analysis, without owning the underlying funds or shares.
Who Usually Considers Investing in Indices?
Index investing isn’t a one-size-fits-all approach, but it can suit a variety of investors depending on their goals and preferences. Here’s a look at who might find this strategy appealing:
Long-Term Investors
For those with a long investment horizon, such as individuals saving for retirement, this style of investing offers a practical way to grow wealth over time. By capturing the overall market performance, investors can build a portfolio that aligns with steady, long-term trends.
Passive Investors
If investors prefer a hands-off approach, index funds can be an option. They require minimal effort to maintain, as they simply track the performance of the market. This makes them appealing to those who want exposure to the markets without constantly managing their investments.
Cost-Conscious Investors
These passive funds typically have lower management fees than actively managed funds, making them attractive to those who want to minimise costs. Over time, this cost-efficiency might enhance overall returns.
Diversification Seekers
Investors who value broad exposure will appreciate the inherent diversification of index funds. By investing in an index, they’re spreading risks across dozens—or even hundreds—of assets, reducing reliance on any single stock.
CFD Index Trading
However, not everyone wants and can invest in funds. Index investing may be very complicated and require substantial funds. It’s where CFD trading may offer an alternative way to engage with index investing, giving traders access to markets without needing to directly own the underlying assets.
With CFDs, or Contracts for Difference, traders can speculate on the price movements of an index—such as the S&P 500, FTSE 100, or DAX—whether the market is rising or falling. This flexibility makes CFDs particularly appealing to those who want to take a more active role in the markets.
One key advantage of CFDs is the ability to trade with leverage. Leverage allows traders to control a larger position than their initial capital, amplifying potential returns. For instance, with 10:1 leverage, a $1,000 deposit can control a $10,000 position on an index. However, it’s crucial to remember that leverage also increases risk, magnifying losses as well as potential returns.
CFDs also enable short selling, allowing traders to take advantage of bearish market conditions. If a trader analyses that a specific index may decline, they can open a short position and potentially generate returns from the downturn—a feature not easily accessible with traditional funds.
CFDs can also be used to trade stocks and ETFs. For example, stock CFDs let traders focus on individual companies within an index, such as Apple or Tesla, without needing to buy the shares outright. ETF CFDs, on the other hand, allow for diversification across sectors or themes, mirroring the performance of specific industries or broader markets.
One notable feature of CFD trading is its accessibility to global markets. From the Nikkei 225 in Japan to the Dow Jones in the US, traders can access indices from around the world, opening up potential opportunities in different time zones and economies.
In short, for active traders looking to amplify their exposure to indices or explore potential short-term opportunities, CFD trading can be more suitable than traditional indices investing.
The Bottom Line
Index investing offers a practical way to gain market exposure, while trading index CFDs adds flexibility for active traders. With CFDs, you can get exposure to indices, ETFs and stocks. Moreover, you can take advantage of both rising and falling prices without the need to wait for upward trends. Whether you're aiming for long-term growth or potential short-term opportunities, combining these approaches can diversify your strategy.
With FXOpen, you can trade index, stock, and ETF CFDs from global markets, alongside hundreds of other assets. Open an FXOpen account today to explore trading with low costs and tools designed for traders of all levels. Good luck!
FAQ
What Is Index Investing?
Index investing involves tracking the performance of a specific financial market index, such as the S&P 500 or FTSE 100, by investing in funds that mirror the index. It provides broad market exposure and is often seen as a straightforward, passive investment strategy.
What Are Index Funds?
Index funds are financial instruments created to mirror the performance of a particular market index. They’re commonly structured as mutual funds or ETFs. At FXOpen, you can trade CFDs on a wide range of ETFs, including the one that tracks the performance of the S&P 500 index.
What Makes Indices Useful?
Indices offer a benchmark for understanding market performance and provide a way to diversify investments. By representing a segment of the market, they allow investors and traders to gain exposure to multiple assets in one investment.
Is It Better to Invest in Indices or Stocks?
It depends on your goals. According to theory, indices provide diversification and potentially lower risk compared to picking individual stocks, but stocks might offer higher potential returns. Many traders and investors combine both approaches for a balanced portfolio.
Does Index Investing Really Work?
As with any financial asset, the effectiveness of investing depends on an investor’s or trader’s trading skills and strategy. According to theory, the S&P 500 has averaged annual returns of about 10% over several decades, making index investments potentially effective. However, this doesn’t mean index investing will work for everyone.
What Are the Big 3 Index Funds?
The "Big 3" index funds often refer to those from Vanguard, BlackRock (iShares), and State Street (SPDR), which collectively manage a significant portion of global fund assets. For example, at FXOpen, you can trade CFDs on SPDR S&P 500 ETF Trust (SPY) tracking the S&P 500 stock market index and Vanguard High Dividend Yield ETF (VYM) which reflects the performance of the FTSE High Dividend Yield Index.
This article represents the opinion of the Companies operating under the FXOpen brand only. It is not to be construed as an offer, solicitation, or recommendation with respect to products and services provided by the Companies operating under the FXOpen brand, nor is it to be considered financial advice.
SPY/S&P500: in the mid-term resistance zonePrice has approached the upper border of the mid-term resistance zone: 598-612.
Until price closes bellow 612, I am preparing for the start of a correction to mid-term support: 564-540.
If price moves confidently above 612, than next resistance target is at 635 level.
The macro-structure of the uptrend from 2022 lows is well intact until price holds above 540 level and assumes higher targets for 2025 at 635-640-670 levels.
I wish everyone Merry Christmas and successful and profitable 2025!
Thank you for your attention.
SPX Is About to Explode – Here’s What I’m WatchingSPX is at a critical level, and whichever way it breaks, the move could be huge. Here’s my take:
If we drop below 5663, I see a move down to 5534 – 5445. If that zone fails, we could head toward 5332, and if selling pressure keeps up, 5234 might be next.
But if we break above 5800, the bulls could take over, pushing to 5972, and maybe even 6149.
It’s all about reaction levels now. I’m watching these zones closely—what’s your take? Are we heading up or breaking down?
Kris/ Mindbloome Exchange
Trader Smarter Live Better
All Federal Employees To US PopulationI think it is important for people to full understand that the 172,000 job cuts from the Federal Government is more about showmanship than logic.
The federal gov employees as a % of the population has been falling for decades through the growth of the population and the economy.
This is the absolute best way to reduce gov. Debt, deficits, etc.. through growth, NOT cutting and causing a heart attack!
Slow mythological, calculated cuts if/when they are required are fine. chaotic, reactive, for the sake of showmanship is NOT!
This will not end well. There will be consequences, people have yet to realize and appreciate the severity of these actions.
These actions taken by the current administration will be felt in the markets.
SPY Weekly Chart! I think downtrend has startedFrom a weekly chart perspective, I think we are going to start bear market pretty soon. Volume has been the lowest and I also see TTM squeeze in the weekly which was last seen in the pandemic era. I really think that investors should sell or cover their open positions.
Dollar Index (DXY): Pullback From Resistance
I think we may see a local bearish continuation after a test
of a key daily/intraday resistance.
A local Change of Character on an hourly clearly shows the strength of the sellers.
The index may retrace at least to 106.53
❤️Please, support my work with like, thank you!❤️