Dow Jones Index (US30): Detailed Technical Outlook 📈
Price action analysis on US30 Index.
Key levels & the things to watch.
Your detailed trading plan.
❤️Please, support my work with like, thank you!❤️
Indexes

DOLLAR INDEX (DXY) Bullish Continuation Ahead? 💵
Confirmed bullish breakout of a key level on DXY.
Watch & learn what to expect from the index next.
Structure analysis & price action analysis included.
❤️Please, support my work with like, thank you!❤️

Nasdaq-100 Index (US100) Bearish Outlook Explained
Nasdaq reached a key daily supply zone last week.
The market was rejected heavily from that.
Analyzing a 4H time frame, I spotted a confirmed bearish reversal:
the price formed a double top pattern and closed below its neckline.
The index may drop soon to 12279 / 12058
❤️Please, support my work with like, thank you!❤️

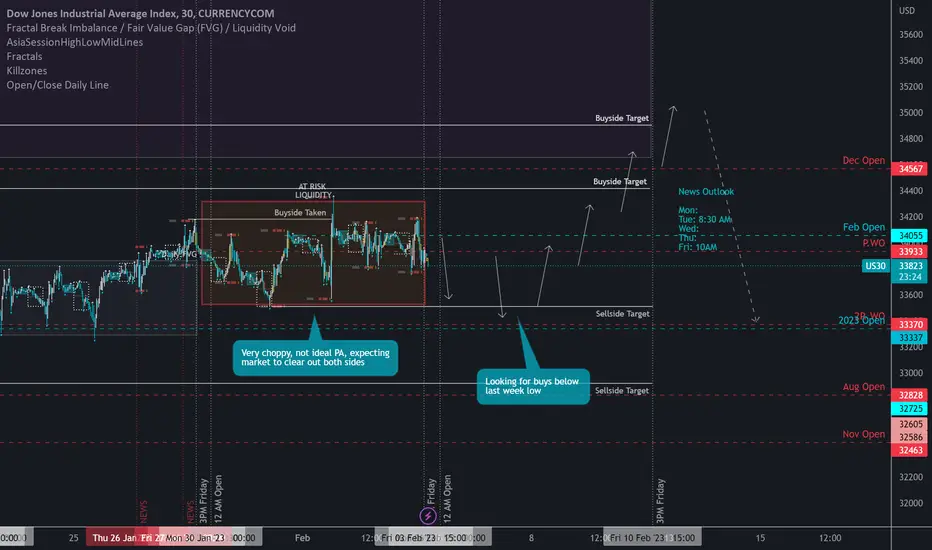
US30 Outlook 2/5US30 price action hasn't been pretty over the last week, I still see reasons for it to appreciate, but I think the low of last week could be taken out first. Either way I don't love the PA and probably wont be trading it in the short term.
Dollar Index (DXY): Bullish Continuation Ahead 💲
Dollar Index reached a key daily structure support this week.
The price gapped down and closed below that on a daily.
It turned out that it was a false breakout.
The market bounced sharply on Friday, forming a high momentum bullish candle.
I think that the index may go higher.
The goal for buyers is 103.3 level.
❤️Please, support my work with like, thank you!❤️

Dow Jonex Index (US30): Your Trading Plan For Next Week
Dow Jones was nicely rejected from a horizontal key resistance.
The market is currently growing within a rising channel on 4H.
I would look for shoring opportunities after its support breakout.
Wait for its violation and then sell aggressively or on a retest.
Goals: 33570 / 33315
❤️Please, support my work with like, thank you!❤️

DOLLAR INDEX (DXY) Bullish Wave is Coming? 💵
Price action analysis on Dollar Index.
Key levels & candlesticks.
Trading recommendations & thoughts.
❤️Please, support my work with like, thank you!❤️

Nasdaq-100 Index (US100) Important Breakout
After the yesterday's rate high, US100 index broke a key daily structure resistance and closed above that.
The broken structure turned into support.
The index will most likely keep growing.
Next resistances: 12769 / 13130
❤️Please, support my work with like, thank you!❤️

S&P500 Index (SPY): Bullish Outlook Explained
S&P500 Index kept growing this week.
The next strong resistance that I see on the chart is 4123 - 4143 area.
I believe that the index will reach that next week.
❤️Please, support my work with like, thank you!❤️

Dollar Index (DXY): Key Levels to Watch 💵
Here is my latest structure analysis for Dollar Index.
Support 1: 101.0 - 101.3 area
Support 2: 99.25 - 99.95 area
Support 3: 97.25 - 98.1 area
Resistance 1: 103.4 - 103.8 area
Resistance 2: 105.15 - 105.8 area
The market is slowing down after a strong bearish wave.
We will most likely see a pullback from Support 1.
Consider the underlined structure for pullback/breakout trading.

S&P500 Index (SPY): Bullish Outlook Explained
Hey traders,
As I predicted, S&P500 index has nicely respected a key horizontal structure support on a daily.
I believe that the market will keep growing next week.
Goals: 4014 / 4059
❤️If you have any questions, please, ask me in the comment section.
Please, support my work with like, thank you!❤️

Dollar Index (DXY): Bullish Move is Coming?! 💵
Daily / 4h time frame analysis on Dollar Index.
Key levels, price action.
Potential scenarios & recommendations.
❤️Please, support this video with like and comment!❤️

Nikkei 225 Index (NI225): Classic Bullish Reversal
It looks like Nikkei is finally ready to start a correctional movement.
After a text of a key daily structure support, the price formed a double bottom and head & shoulders pattern.
Their neckline was broken with a high momentum bullish candle yesterday.
Bullish pressure will continue.
Goals: 27270 / 28050
❤️If you have any questions, please, ask me in the comment section.
Please, support my work with like, thank you!❤️

Dollar Index (DXY): Time to Grow 💲
On a yesterday's live stream, we discussed Dollar Index.
The market reached a major rising trend line on a daily.
Approaching that, the price formed an inverted head & shoulders pattern on 4H.
Its neckline is broken now.
A correctional movement is expected to 102.95 / 103.33
❤️If you have any questions, please, ask me in the comment section.
Please, support my work with like, thank you!❤️

DOLLAR INDEX (DXY) Time For Correction?! 💵
Dollar Index looks oversold to me:
the market was contracting within the boundaries of a falling wedge pattern - a classic reversal pattern.
Its resistance was broken today.
I expect a correctional movement to 102.86 resistance now.
❤️If you have any questions, please, ask me in the comment section.
Please, support my work with like, thank you!❤️

s&p500 analysisThe red zone is important and will be canceled if the climbing targets are passed
We have a block order at the bottom that can bounce back

S&P500 INDEX (SPY) Bullish Outlook For Next Week
S&P500 Index broke and close above a key daily structure resistance.
Following the CPI report, I believe that the index will keep growing next week.
Next resistance - 4060
❤️If you have any questions, please, ask me in the comment section.
Please, support my work with like, thank you!❤️

DOLLAR INDEX (DXY) What to Look At Next Week 💵
Dollar Index dropped sharply this week.
The price reached a key daily rising trend line.
Probabilities will be high to see a pullback from that.
Your confirmation will be a bullish breakout of a falling wedge pattern on a 4H time frame.
Patiently wait for a violation, a bullish movement will be expected to 102.9 then.
❤️If you have any questions, please, ask me in the comment section.
Please, support my work with like, thank you!❤️

Nasdaq-100 Index (US100) Classic Bearish Setup
Nasdaq Index reached a peculiar confluence zone based on a horizontal daily resistance and 0.5 retracement of the last bearish impulse.
The price formed a double top formation, testing that on an hourly time frame.
Its neckline is now broken.
The market will most likely drop to 11260
❤️If you have any questions, please, ask me in the comment section.
Please, support my work with like, thank you!❤️

S&P500 Index (SPY) Bullish Continuation 📈
S&P500 Index broke and closed above a solid supply zone on a daily.
The broken structure turned into a demand area now.
I will expect a bullish continuation to 4064 now.
❤️If you have any questions, please, ask me in the comment section.
Please, support my work with like, thank you!❤️

Dow Jonex Index (US30): Bullish Outlook Explained
Hey traders,
Dow Jones Index formed an ascending triangle formation on a daily time frame last week.
Its neckline was based on a solid horizontal key level.
On Friday, the price broke and closed above that.
I believe that the market will go higher soon.
Targets: 34060 / 34370
❤️If you have any questions, please, ask me in the comment section.
Please, support my work with like, thank you!❤️

DOLLAR INDEX (DXY) Detailed Technical Outlook 💵
Here is my video analysis on Dollar Index.
In this video, we will discuss:
Price action analysis.
Key levels.
Potential scenarios explained.
❤️Please, support this video with like and comment!❤️

Dow Jonex Index (US30): Bullish Outlook For The Next Week
Hey traders,
Dow Jones broke and closed above a neckline of an ascending triangle formation on a daily.
I believe that it may trigger a bullish continuation.
Next goal - 34070
❤️If you have any questions, please, ask me in the comment section.
Please, support my work with like, thank you!❤️
