$DXY onward 👁🗨*This is not financial advice, so trade at your own risks*
*My team digs deep and finds stocks that are expected to perform well based off multiple confluences*
*Experienced traders understand the uphill battle in timing the market, so instead my team focuses mainly on risk management
!! This chart analysis is for reference purposes only !!
If you want to see more, please like and follow us @SimplyShowMeTheMoney
Indexes

DOLLAR INDEX (DXY) Key Support Ahead 💵
Hey traders,
Dollar Index is retracing from a new daily high.
Ahead is a very peculiar zone of confluence:
we see a perfect match between a horizontal demand area and a rising trend line.
I will expect a bullish move from a blue zone.
Initial target - 107.18
❤️If you have any questions, please, ask me in the comment section.
Please, support my work with like, thank you!❤️

SPX ~6000 if this time is not differentThe SPX chart has 2 goals and one constraint:
Demonstrate the VIX / VVIX ratio as an inverse momentum indicator for SPX. The VIX is risk adjusted" by VVIX and the ratio is more useful than VIX alone. "Useful" is similar to 'Statistical Power' and means less data required to identify smaller changes amidst higher volatility.
Suggest that an ATH of SPX 6000 is "not unreasonable" considering the pattern and magnitude of prior large moves (corrections, bear markets, and very large dips)
. . . Unless this time is different.

Dow Jones Index (US30): Key Levels to Watch Next Week 📈
Hey traders,
Here is my latest structure analysis for Dow Jones.
The index keeps growing, and here is the list of resistance to watch for occasional retracements:
Resistance 1: 33270 - 33500 area.
Resistance 2: 34000 - 34270 area.
Resistance 3: 35280 - 35520 area.
Consider the following supports for pullback trades:
Support 1: 31390 - 31900 area.
Support 2: Falling trend line.
Support 3: 29670 - 30166 area.
Good luck next week!
❤️If you have any questions, please, ask me in the comment section.
Please, support my work with like, thank you!❤️

Possible Bearish Continuation For Stocks
Following on from my previous stock ideas, I'm expecting a further downswing after the consolidation bounce on most stocks for a Wave 'C' once the bearish continuation symmetrical triangle breaks down
Waiting for directional break currently
DJ:W1DOW
SP:SPX TVC:SPX OANDA:SPX500USD
OANDA:NAS100USD
NASDAQ:NQGM NASDAQ:NQGI

Nasdaq-100 Index (US100) Your Trading Plan For Today
This morning with my students we spotted a very bearish setup on US100.
The price reached a key daily structure.
Analyzing the reaction of the price to that on lower time frames, we spotted a double top formation on 1H.
Our confirmation to short is its neckline breakout. We need an hourly candle close below 12850.
Target will be 12688.
If the price sets a new high, the setup will be invalid.
❤️If you have any questions, please, ask me in the comment section.
Please, support my work with like, thank you!❤️

Dow Jones Index (US30): Detailed Technical Outlook 📈
Weekly/daily time frame analysis on Dow Jones.
Price action, key levels.
Potential scenarios explained.
❤️If you have any questions, please, ask me in the comment section.
Please, support my work with like, thank you!❤️

S&P500 Index (SPY) Breakout & Bullish Continuation 📈
Hey traders,
S&P500 finally broke and closed above a resistance line of a falling channel on a daily.
I expect a bullish continuation to 4075 / 4175 resistance now.
For entries, consider an occasional retest.
❤️If you have any questions, please, ask me in the comment section.
Please, support my work with like, thank you!❤️

US100: Bullish Continuation is Highly Probable! Here is Why:
Here is our today's forecast for US100.
Our analysis is based on current market fundamental sentiment.
According to our drawing US100 is trading within a support area.
Based on our view the price will rise
to the underlined supply zone.
Like, comment and subscribe to our TradingView Page.
❤️ Please, support our work with like & comment! ❤️

DXY indexlast week we counter traded this move down successfully this week will be looking to trade the trend..
If your part of the team then you will know what to look for..
TVC:DXY

S&P500 Index: Your Trading Plan For Next Week 📈
Hey traders,
This week, I have nicely predicted a bullish move on SPY.
Ahead is a strong vertical resistance now.
The price is trading in a falling parallel channel and it is approaching its upper boundary at the moment.
I would suggest looking for a breakout trade next week:
wait for a daily candle close above the trend line and then buy on a retest expecting a bullish movement at least to 4072.
Good luck!
❤️If you have any questions, please, ask me in the comment section.
Please, support my work with like, thank you!❤️

S&P500 Index (SPY) We Caught Nice Bullish Move! What is Next 📈
Important update for S&P500 index.
Price action and multiple time frame analysis.
Important decision ahead explained.
❤️Please, support this video with like and comment!❤️

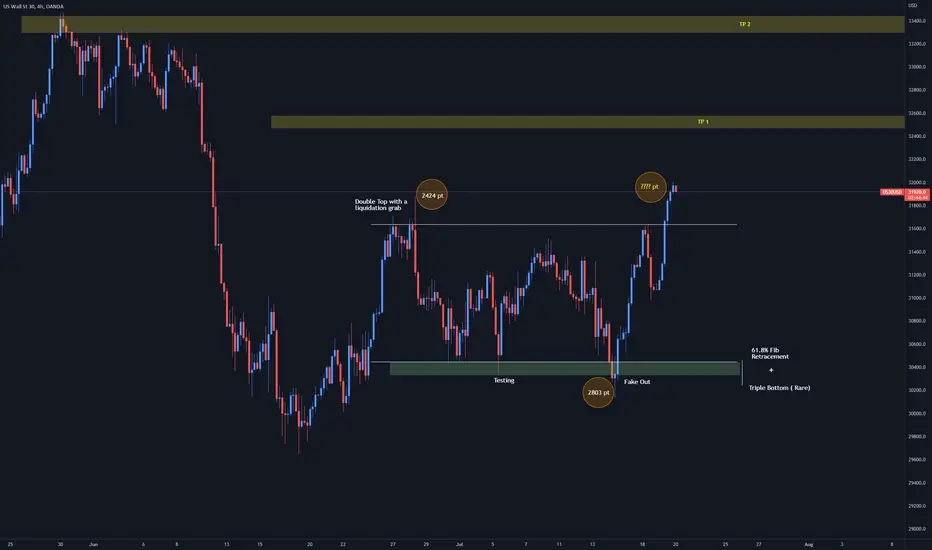
US30 Midweek Analysis 7/20/22It seems we may have a legit breakout on our hands ladies and gents. :-)
Currently measuring the point values on this pair to determine if this is a legit breakout or not. Price filtering with additional technical data such as the ADR is a great way to determine if a pair is doing a legit breakout. I will also be looking at the volume profile for U30.
Dow Jones Index (US30): Important Decision Ahead! Your Plan: 📈
Multiple time frame analysis on US30.
Key levels, price action analysis.
Structure levels & trading plan.
❤️If you have any questions, please, ask me in the comment section.
Please, support my work with like, thank you!❤️

Critical Period for the Markets - To Buy or Not to BuyNot accounting for any fundamentals, the OANDA:SPX500USD and the OANDA:US30USD had a strong rejection from heading lower in 3 consecutive weeks.
Fundamentals will be required to decide whether the market is moving back to a long term BUY.
We hit a low of ~-20% from the highs on the DJIA and ~ -25% from the highs on the S&P500.
On multiple time frames, prices are in a key area.
From technical analysis on the daily chart:
1) potentially a double top was forming but did not break the neckline
2) then a double bottom is forming and now we're waiting to see if it breaks the neckline, which is also a major resistance
3) the double bottom formation was pushed up from a 1D demand area, which is also a 1M demand area.
Looking at the candle on a weekly chart, it shows a pretty strong rejection.
1) Price printed a lower low vs the previous week at 3721.6 vs 3741.6
2) Previous week was a bullish candle, and this week we have a bearish candle closing in the body of the previous week's candle.
3) Strong rejection candle printed on 14 Jul 2022 with huge wick, followed buy a very strong bullish candle
4) We're facing a resistance zone that was tested multiple times but failed to break.
I am expecting a potential fake out for price below 3950, but if candle closes higher, I think we can call buys. (purely based on technical analysis) With fundamentals, we could be more sure of the probability of how the market will move.

S&P500 Index (SPY) Detailed Video Analysis & Things to Watch 📈
Price action analysis on S&P500.
Weekly / daily time frame analysis.
Potential scenarios and thoughts.
❤️Please, support this video with like and comment!❤️

Dollar Index (DXY): Key Resistance Ahead! Your Plan: 💵
Hey traders,
Dollar index is currently approaching a solid monthly structure resistance.
I believe that we may see a pullback from that structure.
Next week, pay close attention to lower time frame and look for a confirmation to short.
I will post an update once I see a decent confirmation.
Good luck!
❤️If you have any questions, please, ask me in the comment section.
Please, support my work with like, thank you!❤️

Dow Jones Index (US30): Key Levels to Watch 📈
Here is my latest structure analysis for US30 index.
Support 1: 29675 - 29968 area
Support 2: Falling trend line linking lower lows
Resistance 1: 32500 - 32800 area
Resistance 2: 33300 - 33475 area
Consider these structure for pullback / breakout trading.
❤️If you have any questions, please, ask me in the comment section.
Please, support my work with like, thank you!❤️

DOLLAR INDEX (DXY) Key Resistance Ahead! 💵
Hey traders,
It looks like soon we will see a pullback on dollar index.
Watch this video and learn what to expect.
Trading recommendations & structure analysis are included.
❤️Please, support this video with like and comment!❤️

Dow Jones Index (US30): Bullish Outlook For Next Week 📈
Hey traders,
As you remember, we spotted together a major weekly demand zone on US30.
The price has perfectly respected that and we saw a nice pullback.
I believe that the market may keep growing in such a manner.
Taking into consideration that the index is too oversold,
be prepared for a continuation of a correctional movement.
❤️If you have any questions, please, ask me in the comment section.
Please, support my work with like, thank you!❤️

Major DXY Top - Harmonic Elliott WaveI believe a cycle top is close. The macro structure suggests a macro top from the bullish cycle started in 2008. It's difficult to really know for sure where that correction is likely to end.

DJI will have some hurdles next week.Hello Friends!
I believe DJI has more downside. Currently, it’s trading in the channel that was developed in 2009 to current. Week of June 13th it tested the bottom of the channel at 29653. Now it’s approaching strong resistance at 31533. Going into next week I think any negative news can push this out of this channel and on its way to test the 28495-28902 gap.
As always thanks for your follows, likes, and comments. Let’s learn and grow together. Cheers!
*This information and publication is not meant to be, and do not constitute, financial, investment, trading, or other types of advice. Do your own research.

Dow Jones Index (US30): Price Action Analysis 📈
Technical outlook on US30 index.
Price action, key levels & structure.
Potential scenarios explained.
❤️Please, support this video with like and comment!❤️
