S&P500 Index (SPY) Price Action Analysis & When to Buy 📈
Swing analysis on S&P500.
Price action & structure.
Trading recommendations & directional bias.
❤️Please, support this video with like and comment!❤️
Indexes

Correctional Recovery on US30/DJIThese days have brought Major Suffering to the Markets, with even the US Indexes failing numerous times to make a comeback for a prolonged amount of time. The level of confusion in investor's perception is very high, with proper direction only seen in Pockets of AfterHours trading, and rarely in normal Normal Market Hours. Both swing trading, and scalping have become rough. Corrections are known to last for some time, however there is hope to see proper March Rallying, and a gradual climb back up to ATH in the coming weeks, as long as fundamentals can clear up (Russia, Energy Prices, Inflation, etc...).
- Here is a likely analysis for the coming weeks / midterm. A possible retest of the correctional point may occur, as well as waterfall/reversal movement along any point of major resistance. Weakness may last, however Volume is sure to pick up at random times of positive fundamentals. Patience for the real Rallying will last!


DOLLAR INDEX (DXY) More Growth is Coming! 💵
Weekly/daily time frame analysis on DXY.
Price action & key levels.
Trading recommendations & thoughts.
❤️Please, support this video with like and comment!❤️

MarketBreakdown | WTI Crude Oil, AUDUSD, Silver, Dollar Index
Hey traders,
here is a brief technical outlook of 4 peculiar instruments in my watch list.
1️⃣ WTI Crude Oil - Daily time frame 🛢️
The market is sharply bullish.
The price is growing within an expanding wedge pattern.
Try to catch a trend-following movement from a support of the wedge
and look for scalp shorting from its resistance.
2️⃣ Dollar Index - 3 days time frame 🇦🇺🇺🇸
For the last three months the pair is consolidating.
The market is stuck within a horizontal trading range.
0.70 is its support.
0.73 - 0.731 is its resistance.
The market is currently approaching the upper boundary of the range.
Look for shorting opportunities from that or if you are bullish biased, consider a bull breakout trade.
3️⃣ Silver - Weekly time frame 🪙
The market recently broke a major falling trend line.
Now we see its retest.
I expect a bullish continuation at least to 25.6 level and then potentially to 26.4.
4️⃣ Dollar Index (DXY) - 3 days time frame 💵
Current geopolitical situation pushes the index to new highs.
The market is growing within an expanding wedge pattern and for now I expect
a bullish trend continuation within its boundaries till the situation is not resolved.
(something tells me that it won't be fast)
❤️Please, support this idea with a like and comment!❤️

$IWM Prepares for massive selloff following global crisesBearish Midterm...Will keep a track of this to see how it does.

2 Possibilities for the SP500There was some strong buying at the recent lows that is reflected in the RSI divergence. There is a possibility of move up to 4530 level if this strength continues. However, the SP500 is also at the top it's steep downward channel and may just move south from here to the bottom of the channel. The market fundamentals are worse than when we saw the January lows so breaking those lows is more likely than a new high. With the war in Ukraine and fears of escalation across the region and the possibility of China seizing Taiwan on the table, keep your positions small and as technicals will not overrule a major news event.

S&P500 Index (SPY) Good Moment to Short? Or... 📈
Multiple time frame analysis on Spy.
Price action & structure analysis.
Great shorting opportunity explained.
❤️Please, support this idea with like and comment!❤️

DOLLAR INDEX (DXY) Technical Outlook 💵
Weekly/daily time frame analysis on DXY.
Price action & swing analysis.
Scenarios & thoughts.
❤️Please, support this video with like and comment!❤️

NDX Crash Last ReminderThis is the last of all 3 major US indexes that we are tracking... Let's see what the chart has to say.
We've been following the correction that started a few weeks back.
Looks like bearish momentum can start to pick up.
We can see that lasts weeks candle closed below EMA50 and this week we have red.
With a bearish RSI, trending lower and lower and the MACD going below zero, it is only a matter of time before the next support level is tested.
You can check my previous trade ideas on this index for all the details, the support levels, the chart signals & more.
7-Feb.
28-Jan.
26-Jan.
19-Jan.
Leave a comment and please choose to follow my work.
Your support is always appreciated.
Namaste.


US100: Very Bullish Outlook 📈
This morning with my students we spotted a great bullish setup on US100 with my students:
the index dropped to a key daily demand zone.
On that, the market was accumulating.
The price formed a classic bullish accumulation pattern.
Breaking its neckline to the upside the index confirms a prevailing bullish pressure.
Growth is expected to 15500 / 16500
❤️Please, support this idea with like and comment!❤️

GER40 ON CONFİRMATİON LEVEL GER40 Price exceed resistances area and it comes to confirmation level , unless price is below trend, we can keep our buy positions

Indexes - What are they and how do they work?Index tracks performance of multiple assets that are grouped together. One of the first people to introduce the concept of indexing were Charles Dow and Edward Jones when they created the Dow Jones index in 1896. This concept allows for an easy tracking of performance of any particular sector within the economy. For example, the Nasdaq 100 index tracks performance of hundred biggest tech companies in the U.S.; similarly, the Russell 3000 index tracks three thousand largest companies in the United States. These indexes contain U.S. securities which account for over 90% of U.S. corporate equity; therefore, analyzing an index provides an investor with information about the overall health of the economy or particular sector.
Diversification
Generally, investing in indexes is associated with lower risk than investing in stocks. This is because indexes are structured in such a way that they diversify risk by tracking performance of multiple assets rather than by tracking performance of one single asset. For example, if an investor's portfolio consists of shares of a single stock company and the value of those shares drops, then it directly affects the portfolio in a negative way. However, if an investor owns an index tracking performance of 10 companies instead of a one stock title, then the investor's risk is diversified among ten companies instead of one single company. Therefore, an index tends to perform well as long as the majority of its components perform well. Similarly, when the majority of companies incorporated within an index perform poorly then the index tends to reflect it.
Illustration 1.01
Illustration above depicts the monthly chart of Hang Seng Index (Ticker: HSI). It is observable that the index performed well in the long-term. Though, massive drops in the index are observable too in 1997, 2000, 2007, 2015 and 2018.
Source: www.tradingview.com
Value of the index and weight distribution
The value of an index is dependent on its underlying holdings; further, it can be based on the price, market-cap or any other metric related to these assets. There are various methods on how to weight an index which plays an important role in how it performs. For example, in an unweighted index all its components have equal significance, regardless of their size. However, in a market-cap weighted index these components hold significance that is proportional to the size of their market-cap. Therefore, a volatile move in a big company would have a bigger impact on the overall performance of an index as opposed to the volatile move in a small company. Most indexes are price-weighted and market-cap weighted.
Indexes as financial assets
Generally, indexes tend to move in trends and produce good results over a long-term period. Index investing is preferable for inexperienced and passive investors because it tends to outperform active management in the long run. Additionally, it takes off psychological pressure that is associated with an actively managed portfolio while providing more free time to an investor. Exposure to an index can be gained by investing in index futures, options, CFDs, ETFs and other derivatives.
Major indexes include:
Dow Jones Industrial Average - thirty large U.S. companies that trade on the NYSE and NASDAQ.
Nasdaq 100 - hundred biggest tech U.S. companies that are publicly traded.
Standard & Poor 500 - five hundred biggest companies in the U.S. that are publicly traded.
Russell 2000 - two thousand smaller companies that comprise the Russel 3000 index.
Russell 3000 - three thousand biggest companies in the U.S. that are publicly traded.
DAX 40 - forty biggest German companies that trade on the Frankfurt Exchange.
Hang Seng Index - sixty biggest companies that trade on the Hong Kong Exchange.
Seasonality and trends
Indexes tend to move in cyclical trends and less often in trading ranges. They are less prone to the effects of calendar and industrial seasonality when compared to stocks and commodities.
Change in components
Since their inception many indexes have changed the composition of their underlying assets. For example, the Dow Jones Industrial Index started as Dow Jones Transportation Average in 1896 and consisted of only twelve companies. These companies operated mainly in railroads, cotton, tobacco, gas and oil sectors. However, eventually new companies were added to the index until it reached the total number of thirty companies in 1928. Since then the composition of the index changed several times; although, the number of companies stayed the same. This concept of rebalancing indexes is common to many other indexes; and it usually occurs on a quarterly basis.
Illustration 1.02
Picture above shows the monthly chart of the Nasdaq 100 Index (Ticker: NDX) between 1995 and 2006. Companies included in this index changed over time. Nowadays, the Nasdaq 100 index includes such companies as Alphabet, Apple, Microsoft, Intel, Tesla, etc.
Source: www.tradingview.com
If you have not read our previous articles on stocks and commodities, please feel welcome to do so. They are attached to this idea. Additionally, feel free to express your own thoughts and ideas in the comment section below.
DISCLAIMER: This analysis is not intended to encourage any buying or selling of any particular securities. Furthermore, it should not serve as a basis for taking any trade action by an individual investor. Your own due diligence is highly advised before entering trade.

DJIA Is Rebounding from The Lower Boundary of The Upward ChannelThe DJIA has been moving in an upward channel since around mid-June 2021. Recently the index formed a long bullish hammer candle that successfully confirmed a significant support area of a rising window/gap at 33,175 (this is called the cluster of candles). All the last week candles closed over the lower boundary of the rising channel and the 0.236 Fibonacci retracement level at 34060 as well as the 251-day EMA. In addition to this, there is a bullish divergence signal from the Williams %R out of the oversold zone. Therefore, the index is moving to test the levels at 35063, 35513 and 36152. In contrast, declining below the levels at 34060 and 33160 should indicate a further bearish move ahead.

The Dow Jones Industrial Average: Not All RedThis is the last (DJI) of the three major indexes (SPX, NDX, DJI) we track for the United States.
The Dow Jones Industrial Average (DJI) is also bearish on the daily, weekly and monthly timeframes... But we have something going on in the weekly chart.
DJI Weekly (W):
- As you can see, we have a Doji with high volume on this weekly candle. Prices remain above EMA50.
Now, this can be considered good and can lead to a reversal but confirmation is needed first.
For a bullish reversal, the weekly candle most close GREEN/Strong/Above EMA50 for the door to higher prices to open.
The MACD and other indicators are strongly bearish though:
Even though we have this signal, when we look at the Daily and Monthly timeframes we can see that the bears are still on top.
We also have the same situation on the monthly timeframe as we saw with the S&P 500 Index (SPX).
It is just moving and closing below EMA10 for the first time since February 2020... What follows we will know soon.
Be aware!
Be prepared!
This can turn into something massive, this huge "crash/correction", but we are all coming out of it bigger, better and stronger that's for sure!
Namaste.

S&P500 Index (SPY) Huge Demand Zone Ahead 📈
Hey traders,
S&P500 lost more than 10% from ATH.
Now the price is approaching a major structure area.
4140 - 4270 is a demand zone from where the price was nicely rejected yesterday.
I believe that the market may start growing from that area.
Goals:
4486
4728
What do you expect from the market?
❤️Please, support this idea with like and comment!❤️

DOLLAR INDEX (DXY) Time to Fall! 💵
Dollar index broke and closed below a support line of a major rising parallel channel on a daily.
Retesting the broken support the price formed a head and shoulders pattern.
Its neckline violation confirms a coming bearish rally.
Targets:
94.9
94.66
❤️Please, support this idea with like and comment!❤️

S&P500 Index (SPY) Buying on Dips 📈
I bought SPY again.
After setting a new ATH the market retraced to the support line of a major rising parallel channel on a daily.
My confirmation was a bullish breakout of an expanding wedge pattern on 1H time frame.
I expect a bullish move to retest the current high & then to new highs.
❤️Please, support this idea with like and comment!❤️

S&P500 Index (SPY) Classic Bullish Accumulation Pattern 📈
Hey traders,
S&P500 is trading in a global bullish trend.
However, since November the market is consolidating.
The price sets equal highs around 4750 structure.
At the same time, the index sets higher lows indicating a bullish accumulation.
Your plan is to patiently wait for a bullish breakout of the underlined blue structure and then buy on a retest.
Your goal will be based on a major rising trend line that the price is respecting since May.
❤️Please, support this idea with like and comment!❤️

DOLLAR INDEX (DXY) Time For a Correction? | Technical Outlook 💵
Dollar index looks quite overbought to me.
The price action contracts on intraday time frames
and it looks like quite soon we will see a correctional move.
In this video, we will execute a Top-Down analysis
and we will discuss potential scenarios.
❤️Please, support this idea with like and comment!❤️

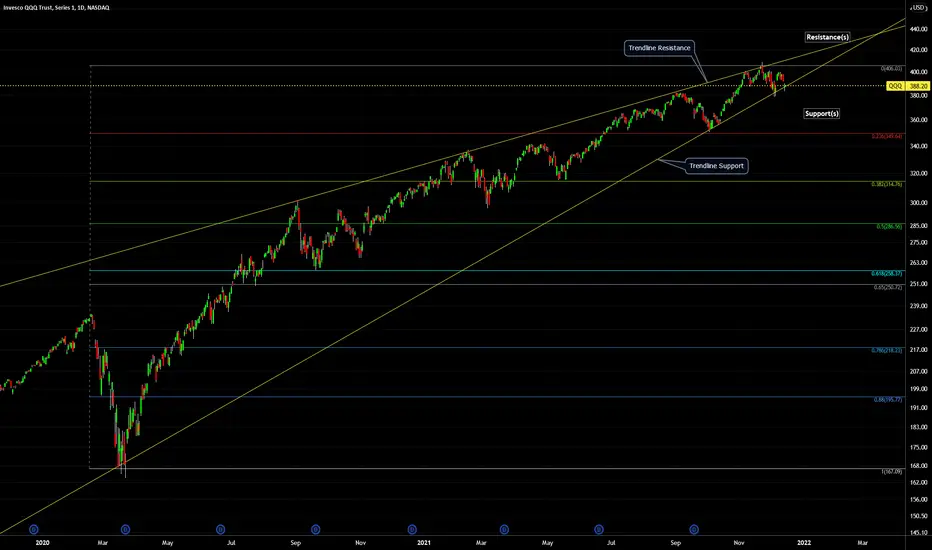
QQQ (Nasdaq ETF) - Support, Resistance, Trendlines, Pattern 2021QQQ (Nasdaq ETF) - Support, Resistance, Trendlines - 2021- Daily:
Price Pattern: potential Head-and-Shoulders.
-Resistance Price Levels (colored horizontal lines above current price)
-Support Price Levels (colored horizontal lines below current price)
-Trendline Resistance (diagonal yellow lines above current price)
-Trendline Support (diagonal yellow lines below current price)
note: chart is on log scale.
DIA (Dow Jones ETF) - Support, Resistance, Trendlines 2021 - DayDIA (Dow Jones Industrial Average ETF) - Support, Resistance, Trendlines - 2021 - Daily Chart:
-Resistance Price Levels (colored horizontal lines above current price)
-Support Price Levels (colored horizontal lines below current price)
-Trendline Resistance (diagonal yellow lines above current price)
-Trendline Support (diagonal yellow lines below current price)
note: chart is on log scale.
