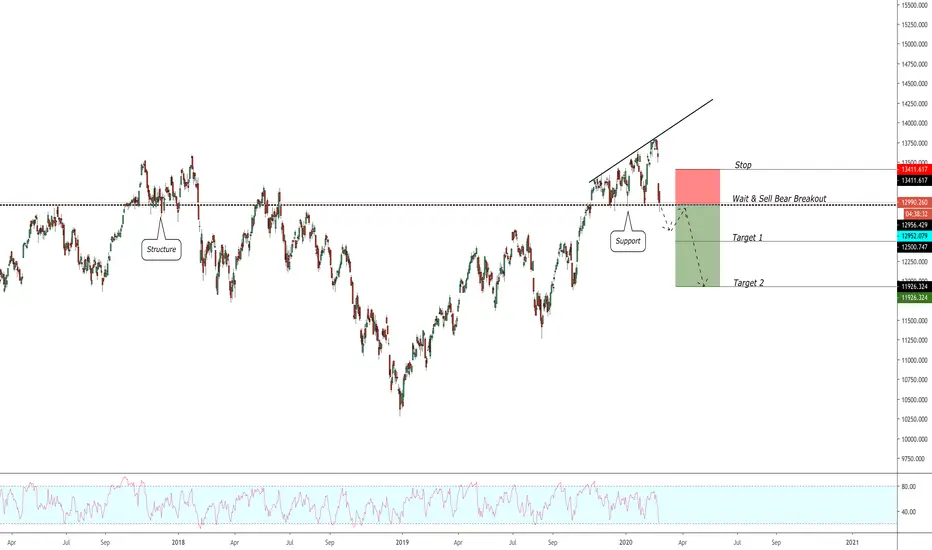
S&P500 Index (SPY) Time For The Next Decision
SPY is stuck in a decision range between two key structure levels.
if you still don't have an active position, the best strategy is to wait for a breakout.
the side of the breakout will show you the future market direction with a high degree of accuracy.
of course, we still stick to a bearish bias and bearish scenario is highly probable,
but in our age of uncertainty, everything can happen!
our first goal for bearish breakout will be 2600 level.
for bullish breakout - 2970
good luck and be patient!
Indexes

#SP500,The declines to where?The SP500 dropped last week and stopped just above the average moving line 100 on the weekly graph, if we look at history in the last two serious price correction, The SP500 fell and did not stop at the 100 moving average line, but continued to the 200 moving average line
According to Stochastic and RSI, the declines have not yet come to an end.
Right now the SP500 is still very technically bullish
Our target will be above the 200 moving average line: $ 2686

S&P 500 Index (SPX500) May Go Much Lower! Key Levels To Note
buyers show their unwillingness to buy on dips.
the market went rejected after a minor retracement from 2888 support.
looks like selling volumes are accumulating and bears preparing for a breakout.
the best strategy for us to follow is to sell the breakouts of these key levels expecting a drop to the next one.
Key levels:
2744
2560
2343
note how perfectly structure matches with key levels.
good luck!
please, support the idea with like! thank you!

UK 100 Index (UKX): Bullish Forecast
completed harmonic bullish bat pattern on UK 100 index.
pattern completion point is lying on a strong horizontal daily structure support.
I belive that this week the index will grow in value at least to 6945 level
with potential continuation to 7245
good luck!

It's just a correction until we break this trend lineTo be a truly successful investor, you have to have very long time horizons. Most of us track trends for days or weeks, but big investment banks and algorithm-driven "smart money" track trends for years or decades. This requires patience that most people can't muster. With that in mind, let's look at some long-term trends in the S&P 500 to see where we might want to enter.
The S&P 500 has maintained the green trend line for over 10 years, since the end of the last recession in 2009. As you can see, there's plenty of room for the S&P 500 to fall before it hits this trend line, say around 2550 (down 12% from the current level). I expect we'll get there within the next couple months.
Then comes the real test: will the market continue to hold its long-term uptrend? Or will we break the trend line support, signaling that the correction has turned into a full-fledged bear market? In the last couple recessions, the S&P 500 finally bottomed at about half the price at the preceding market top. For a hypothetical 2020 recession, that implies a bottom at about 1700, shown as a red horizontal line here on the chart.
Thus, the long-term play is pretty simple: buy the trend line, and sell if it breaks. Wait to re-enter at about half the market top. If you have the patience, you may be able to get in on the ground floor of the next bull market for another 10-year cycle. Embrace the wait, and good luck!

DAX Index On Key Support!!! What to do?
what a huge gap!
we haven't seen such for a long period of time on DAX and it is very telling!
the market perfectly dropped on strong horizontal support and it is the last resort for the buyers.
being broken to the downside, it will trigger selling reaction of market participants giving us a great chance to short the market!
Key levels in case of breakout:
12500
11900
be patient and don't jump in before the breakout!
please, support the idea with like! thank you!
Hang Seng Index (HSI): Bearish Continuation Coming
hey guys,
be prepared to short Hang Seng on bearish breakout of a flag formation.
the trend is bearish,
we saw a fake breakout to the upside recently,
fundamental sentiment is vague!
don't miss this opportunity.
initial target is 25100
then apply trailing stop and try to catch a big winner!
good luck!
please, support the idea with like and comment!
thank you!

SPY likely to move toward bottom of channelI think we're likely to see a correction in the S&P 500 to at least the bottom of the channel, if not lower. On Tuesday the S&P 500 hit 19 forward P/E, making the index the most expensive it's been since 2002 (18 years ago). In effect, the S&P is priced as if there's zero risk in the market right now. Of course, we all know that's not true; between coronavirus and record public and private debt, there's lots of risk out there right now. We've been borrowing money to juice the economy for years, and coronavirus may bring a reckoning.
A huge, long list of companies has issued negative earnings guidance or warnings of business disruption due to the virus, and more companies are likely to do the same next week. Analyst firms will adjust their forecasts and price targets based on companies' guidance. Analyst firms are also sounding warnings that coronavirus's macroeconomic impact is underestimated or that it may cause disrupted companies to default on trillions of dollars of debt. Frankly, we're long overdue for a price correction, and it's ridiculous for the S&P to be mid-channel with so many headwinds. I don't really like to play short, because the market usually goes up long-term, but for those who do play short, now would probably be the time.

Dollar Index (DXY): Midterm Projection
hey traders,
dollar index is approaching a current market high level!
I believe that because of the current overwhelming dollar strength and clear uptrend on the index,
the breakout to the upside and new higher high are inevitable.
even if current resistance is respected, bulls will accumulate volumes on a pullback for continuation to new highs.
key support for the index is 98.0 level.
good luck!

Dollar Index (DXY): Close To Market High
dollar is phenomenally strong these last few weeks,
analyzing the index on a daily,
we see that it is coming closer and closer to a current market high.
projecting abcd harmonic movement and looking left at structure
we may expect with you a retracement from the underlined area.
pay close attention on a daily and remember that closer the market is to the current high,
higher the chances are to see a bearish reaction

Beware a possible market topLast month, I posted an article here on TradingView in which I mentioned three indicators that 2020 might be a banner year for stocks. We had had a strong Santa Claus rally and a strong "first five days" of the year, I pointed out, and unless there was a major end-of-month correction, we were on course to have a strong January. All three of those indicators are highly predictive of full-year performance. Well, guess what? We got a strong end-of-month correction, and we ended January down 0.04% overall. That means we only got 2 out of the 3 bullish indicators, with overall January performance implying a bear year ahead.
Lately we've been rallying from that late January correction, but I'm not sure it can last. If China hadn't announced the removal of half its tariffs, the market would already have resumed a down trend due to growing coronavirus risk. The reality is that coronavirus impact is likely to be larger than the impact of a 50% tariff cut. Analysts are expecting 15% China production cuts in the auto industry, for instance, and oil prices already reflect a huge impact on travel and shipping. So far it's just international travel, shipping, and demand that are affected, but you can probably expect a larger impact on domestic markets within a month or two. My model suggests that the current global count of about 31,500 coronavirus cases is likely to grow to 190,000 by the end of February. (y = 126.23x2 - 1E+07x + 2E+11; R² = 0.999. See my Twitter page @WSPZoo for the graph.)
What might be the impact of coronavirus? Well, a quick review of a 2014 study on Spanish flu in Sweden-- where infection and mortality rates were similar to coronavirus-- suggests that capital returns fell by about 1%, and the poorhouse rate was about 11% higher in the hardest-hit areas than in the least-affected areas (due mostly to kids losing their parents). With the banking sector in the US currently very exposed to any increase in the poverty rate due to higher-than-2007-levels of subprime lending, I'd suggest coronavirus substantially increases the risk of another cascade of defaults like the one that triggered the 2008 Great Recession. The US also has a trillion-dollar deficit and low interest rates, leaving perhaps little room for fiscal stimulus if GDP growth should slow on the order of 1%. In short, this is very worrying.
The tariff news will buoy us a little, but I'm not sure how long it will last. If we end the day down today, then we will have made a bearish divergence on the RSI. And if we end the day down tomorrow, that'll probably give us a bear divergence peak on the MACD as well. I have already changed my allocation to about 75% cash, and it may be a while before I re-enter on anything but a few small option positions.

SSE COMPOSITE: Drop After Gap Close
hey traders,
on Shanghai Stock Exchange the market has recently dropped with a gap.
now it recovers and most-likely the gap will be closed.
what is important here is the fact that the last candle close before the gap gives a strong resistance for the market.
so even in case of a 100% recovery, the market can drop just after the gap will be filled.
good luck!

"Netflix: going up as expected" by ThinkingAntsOk4H Chart Explanation:
- Price broke the Descending Trendline.
- Price broke our first target on the 4H Resistance Zone.
- Price is close to achieve our second target on the Resistance Zone.
Weekly Vision:
Daily Vision:
Updates coming soon!


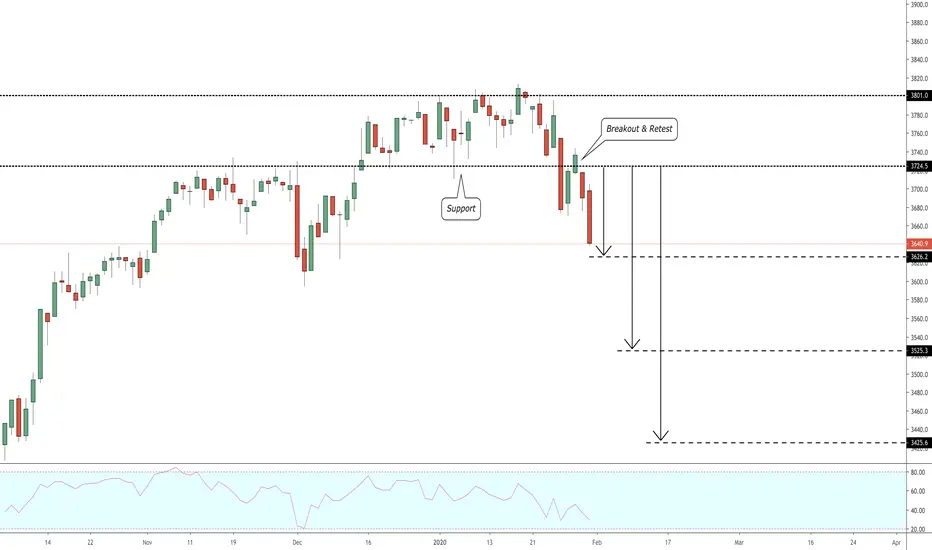
EURO STOXX 50 INDEX (SX5E): Update and Target Extension
Patience pays and those who followed my trading plan made a good profit from this counter-trend short.
now the market is very close to our initial target and I suggest only partial profit-taking.
With the protected position, we can expect with you a drop lower.
I would aim at 3525 levels as the second target and 3425 as the third.
good luck!
Straits Times Index (STI): Important Update
hey traders,
instead of breaking above 3280 structure resistance the market has respected it
and, moreover, set a lower high.
after a lower high formation, the market has dropped below a support line of a flag pattern.
the breakout is considered to be confirmed and our bias switches from bullish to bearish.
from the current perspective, I will expect bearish continuation to 3120 / 3050 / 2980 levels.
protect your profits based on these levels.
good luck!

U.S Dollar Based Borsa Istanbul 30 Index Futures can test ResistAlthough the fragility in the Turkish Lira continues, we see relief from the exchange rate after the Iranian tension.
At least we can expect the index to test the resistance point in the first place.
The ban of short sale in Borsa Istanbul makes me a little startled.
That is why the domestic investor plays ball in the index and volumes are calm.
On the other hand, the weekly chart also showed a buy signal :
So let's take a small position to stay in game.
NOTE :
This analysis was made on the U.S Dollar based value of the Borsa Istanbul 30 Index.
We can make this analysis more risk-free with the following parameters:
Position Size : Small percent of portfolio (%5 - %10 )
Risk/Reward Ratio = 1 / 2
Stop-Loss : 24.200
Goal : 26.325
Furthermore, we can look at discounted XU030 stocks, and then let's we'il talk again.
You can see my U.S Dollar based Turkish Airlines stock position in related ideas, i attached.
Regards.

S&P/TSX Composite Index can test Minor Resistance LevelsWhen we look at Canadian instruments during the Autonomous LSTM Adaptive period:
We see a cheapness in both stock markets and currency.
Even though I have a positive opinion about the target, let's try it out in small quantities and leave more position size in case of a second try on negative scenario.
This analysis can be more risk-free with the following parameters:
Position Size : %1 for Index Futures or Small percentage of Portfolio
Risk/Reward Ratio = 1/1.99
Stop-Loss : 16911.75
Goal : 18032
NOTE:
The unapproved short signal is the leading indicator of volatile movements.
So let's be careful.
Let's leave more room for the second attempt, which, when the circumstances are in our favor, let us gain much more of our loss.
Regards.

"EuroStoxx breaking the Ascending Trendline" by ThinkingAntsOk4H Chart Explanation:
- Price was on an Ascending Wedge since August.
- Price bounced on the Resistance Zone.
- Price broke the Ascending Wedge.
- Now, it has potential to move down towards the Support Zones.
Weekly Vision:
Daily Vision:
Updates coming soon!

#S&P500, Time to sell?The S & P500 is on the rise.
At the moment our sell signal is about the price correction and not about a new trend.
The Stochastic Daily Graph is located in the top third which is a great area to sell.
The RSI is in the 70 area which is Overbought and it is a good time to sell.
Target: $ 3260

Volatility S&P 500 Index (VIX): Back Again On Support
VIX is one more time on support.
as it happened many times in the past, it may bounce.
what changes is the growth potential taking into account the descending trendline.
14.0 is the first resistance level to consider.

DAX INDEX (DAX): Decision Point & Bullish Continuation
it is a very very usual thing for indexes to set new market highs.
DAX is not an exception!
buying volumes are accumulating around the current market high and
I believe that, like with French indexes, we may break to the upside.
with a new higher high formation, the potential for growth will be unlimited.
but no matter how you will react to that, don't be greedy and control your risk.
good luck!

Can the S&P 500 grind higher?Basic analysis of the last two growth periods for the S&P 500 gives us an average headroom value before we can expect next pullback. As we are already through the low-end estimate of 4095 experienced during 2018, we look to the average value of 5471, giving us a price target of $3400 on the /ES. This has been a consensus call among many institutional equity traders since the beginning of the most recent trend in Sept/Oct. 2019.
