Dow Jones Index (US30): Bullish Price Action Ahead of The News
In 1 hour, we are expecting US PPI report.
Ahead of the release of that data, I see a bullish price action on US30.
After a test of an intraday support, the Index started quite a long correction
within a narrow horizontal range.
Its resistance was broken with a strong bullish candle,
indicating the strength of the buyers.
The market may bounce.
Goal - 39600
❤️Please, support my work with like, thank you!❤️
Indexes

Dow Jones Index (US30): Bullish Rally Continues
Dow Jones keep breaking key levels.
This week we saw a breakout of a one more significant resistance.
Bulls clearly show their power.
I will expect a further bullish continuation.
Next resistance - 39850
❤️Please, support my work with like, thank you!❤️

NASDAQ INDEX (US100): Bullish Rally Continues
As I predicted earlier, US100 keeps growing.
Analyzing the index today, I spotted a strong
intraday bullish confirmation.
After a strong bullish impulse, the market started to correct
within a symmetrical triangle formation.
A breakout of the resistance of the triangle signifies that the
correction is over, and that the market returns to a bullish trend.
I think that the Index may reach 12285 level soon.
❤️Please, support my work with like, thank you!❤️

Dollar Index (DXY): Bearish Outlook After News 💵
Today's US fundamentals are very bearish for Dollar Index.
After a test of a key daily horizontal resistance,
the price formed a strong bearish imbalance
and violated a support line of a rising wedge pattern on a 4H time frame.
I think that the fall may continue.
Next support - 104.9
❤️Please, support my work with like, thank you!❤️

Dollar Index (DXY): Important Key Levels 💵
Here is my latest structure analysis and important
key levels to watch on Dollar Index.
Support 1: 103.88 - 104.1 area
Support 2: 102.93 - 103.25 area
Resistance 1: 105.41 - 105.58 area
Resistance 2: 106.37 - 106.52 area
Consider these structures for pullback/breakout trading.
❤️Please, support my work with like, thank you!❤️

NASDAQ INDEX (US100): Intraday Bullish Confirmation
After a breakout of a key horizontal resistance,
NASDAQ retested that and formed an ascending triangle on an hourly time frame.
A bullish violation of its neckline is an important intraday bullish confirmation
and a clear sign of strength of the buyers.
We can anticipate a growth now at least to 18100
❤️Please, support my work with like, thank you!❤️

Dow Jones Index (US30): Bullish Rally Begins?!
Dow Jones formed a huge double bottom pattern on a daily,
after a quite extended correctional movement from all-time high.
The price turned very bullish on Friday after the release of US fundamentals.
The Index broke a solid horizontal resistance.
The market may start a bullish rally now.
Target - 39000
❤️Please, support my work with like, thank you!❤️

Dow Jones Index (US30): Important Breakout
Dow Jones formed a huge double bottom pattern on a daily,
after a quite extended correctional movement from all-time high.
The price turned very bullish on Friday and broke a solid horizontal resistance.
The market may start recovering now.
Target - 39000
❤️Please, support my work with like, thank you!❤️

Dollar Index (DXY): Detailed Technical Analysis 💸
Price action analysis for Dollar Index.
Important key levels.
Directional bias.
Predictions and forecast.
❤️Please, support my work with like, thank you!❤️

Dollar Index (DXY): Important Update Ahead of The FED 💵
Price action analysis for DXY.
Important key levels.
Potential scenarios ahead of FED interest rate decision.
❤️Please, support my work with like, thank you!❤️

Dow Jones (US30): Pullback From Key Level
After a test of a strong horizontal resistance,
Dow Jones broke and closed below a support line of a rising parallel channel
on a 4h time frame.
We can expect a retracement to 38230 / 38066
❤️Please, support my work with like, thank you!❤️

Dollar Index (DXY): Important Breakout 💵
As we discussed on the yesterday's live stream,
Dollar Index broke and closed below a key daily structure support
after a consolidation
Retesting the broken support, we see a positive bearish reaction to that.
It makes me think that the market will drop lower.
Next support - 105.2
❤️Please, support my work with like, thank you!❤️

Dollar Index (DXY): Multiple Time Frame Analysis After PMI 💰
Top-down analysis for Dollar Index.
Price action after US PMI report.
Important key levels.
Potential scenarios.
❤️Please, support my work with like, thank you!❤️

S&P 500 set to advance after a bout of selling on FridayEfforts are underway to head off a full-blown Middle East war.
What’s Happening Now:
A tense calm prevailed in the Middle East after Iran’s missile and drone attack on Israel. Global markets showed signs of stability on speculation the conflict will remain contained.
Iran said there wouldn’t be further attacks as long as Israel didn’t react aggressively, but Benjamin Netanyahu warned, “Whoever strikes Israel, we will strike him.”
A diplomatic race is underway to help ensure any retaliation doesn’t raise the stakes too high.
“It’s right to price more geopolitical risk premia into assets, but at the end of the day equity markets are still only about 2% off all-time highs,” said Timothy Graf, head of EMEA macro strategy at State Street. “This was a well-telegraphed geopolitical development. A lot of the bad news is in the price already.”
As we can see on the chart, the index is still trading in the tight diagonal canal which once broken a higher liquidity impulse can be expected. With the current situation of repricing rate cuts, higher inflation, and war tensions rising I am strongly expecting a quick 3-7% test to the previous lows.

$SPX $SPX500USDSummary
#SPX is approaching a key level where it may make a decision to bounce or break lower.
A zone ranging between 4800 : 4920 "highlighted" will determine the upcoming short term trend.

$DXY - Next Resistances to Watch *W & *D (tf) TVC:DXY *D (tf)
Previous Ideas of Resistance to Watch (before & after 'play button' )
(before & after 'play button' )
Next decent Resistances for TVC:DXY to face will be the 0.5 Macro Fibb Level @107.7 level .
Surpassing that via decent breakout, correction may be anticipated as a retest and
confirmation for TVC:DXY to continue Higher.
Meanwhile on the *W (tf),
TVC:DXY managed not to close its 12 Consecutive Green Weekly Candlestick.
Whats worrying is that the last Weekly Close was very Bearish in Price Action,
printing whats called ' A Topping Tail '

Dollar Index (DXY): Potential Scenarios Explained 💵
That was quite a boring week for Dollar Index.
The market was stuck within a narrow horizontal range on a daily.
Next week, wait for a breakout of the range.
Bullish breakout of its resistance will be a strong trend following signal,
while a bearish violation of its support will initiate a correctional
movement on the market.
Next key resistance - 106.85
Next key support - 105.20
❤️Please, support my work with like, thank you!❤️

NASDAQ INDEX (US100): Technical Outlook & Trading Plan
Daily/4h time frames analysis for US100.
Price action & key levels.
Directional bias.
Thoughts.
Trading plan.
❤️Please, support this video with like and comment!❤️

Dollar Index (DXY): Bullish Trend Continues 💵
Dollar Index may continue growing.
The market reacts positively to a recently broken resistance
and we see a strong bullish reaction.
I believe that the index may easily reach 106.4 level today
and potentially go higher.
❤️Please, support my work with like, thank you!❤️

Dollar Index (DXY): Multiple Time Frame Analysis & Plan 💵
After a breakout of a key daily structure resistance yesterday,
Dollar Index is consolidating within a horizontal range on an hourly time frame.
For those, who are looking for an intraday signal to buy,
a bullish violation of the resistance of the range -
an hourly candle close above 105.32, will give a strong bullish confirmation.
A bullish continuation will be expected at least to 105.6 level then.
❤️Please, support my work with like, thank you!❤️

Dow Jones Index (US30): Pullback From Key Level
Dow Jones may pullback from a key daily support.
I see a nice tiny double bottom formation after a test of the underlined blue area,
with a confirmed violation of its neckline.
Goal - 38860
❤️Please, support my work with like, thank you!❤️

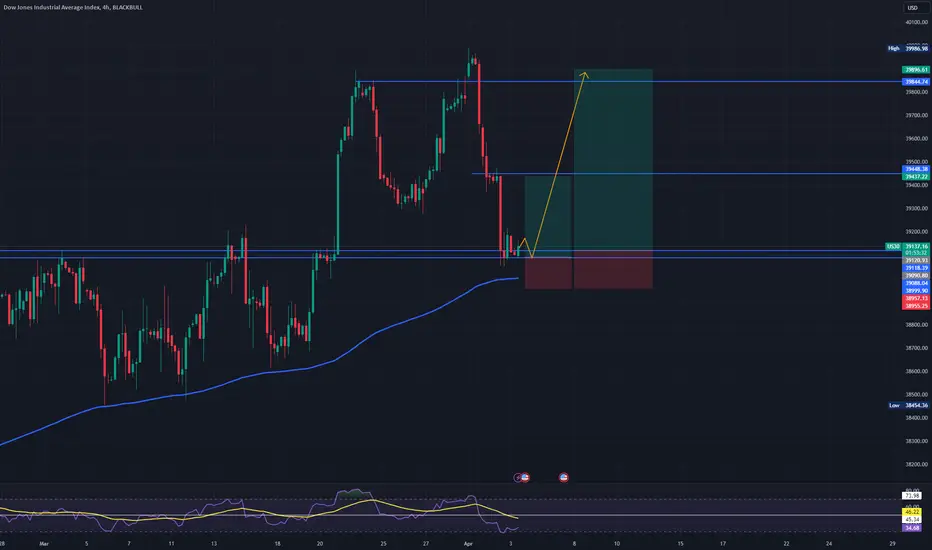
US30 | Ready to retest the price ceiling?The important support area for the US30 index is around the price of 39000. Considering the RSI is in the oversold range, an upward movement with targets at 39448 and 39844 can be expected. 📈
CAC40 #HVF for a doubleBig Pattern = Big Moves
Long consolidations = Fast Breakouts
The #NIKKEI had a beautiful chart pattern and we are seeing the explosive up moves occur in that market.
The French stock market - along much Europe hasn't done much for over two years
But we are quickly approaching Target 1 of a large --- non conventional HVF
Is it monetary stimulus or economic growth that causes the CAC to double?
Don't know ...
One is more desirable of course.
But the same boys
cheering the US stock market screaming higher after a decade plus of stimulus. zero rates and buybacks, does it matter?
@TheCryptoSniper
