US Indexes had a late burst higher to end in the greenMorning Jumpstart Macro View and US market recap 1-02-22
The US had a late session burst higher that dragged the major Indexes into green territory ahead of key US employment data Friday. The USD continues to grind lower while Gold was range bound. Copper had a strong session while Oil continues to hold recent gains setting for another push higher.
For a deeper look at the price action, key levels and what I see playing out...watch the video and feel free to leave any comments.
View more at www.tradethestructure.com
Indextrading

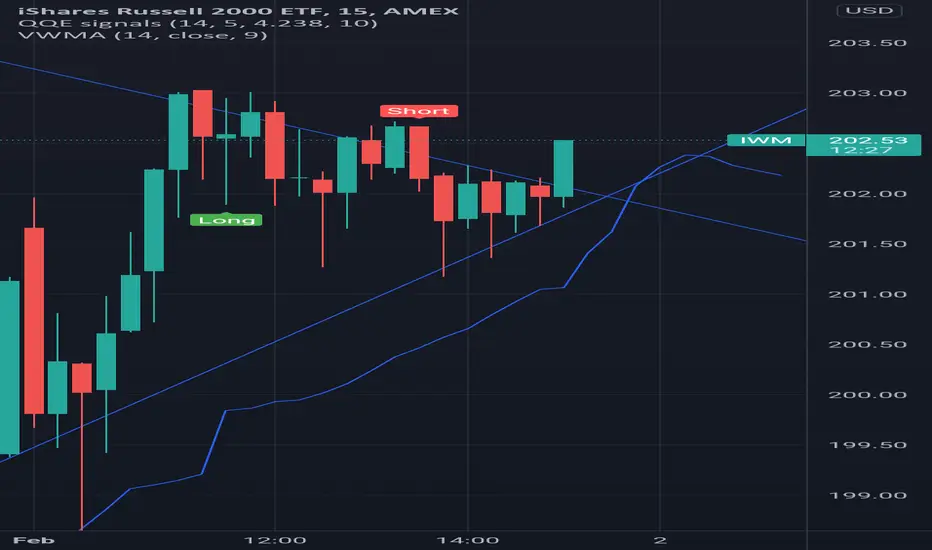
tightening range small caps broke bull (IWM)the tightening range broke to the upside. if we can treat the area as support we could continue higher into upper 202s
consecutive forecast for weeks ahead (TQQQ)i think we will see a lower high, followed by a lower low, but we will stay over the .382, and then continue higher
every period of volatility that dried up quickly or was extenuating in nature was v shaped, and every period that was more exaggerated or corrective in nature was cypher shaped.
we could bull cypher with a touch of support, but if we break it things will get much more serious quite quickly. if we break the 0 of extension the picture will clear up greatly for nasdaq bulls.
sundays session should be bullish continuation, and we should open higher monday and then begin the flush to new lows middle of the week of the 6th, unless we immediately continue higher over 59

nasdaq futures at resistance, could beat it (TQQQ)this is simple. were at the major resistance in nasdaq furures. if we stay over the .382 of fib trend extend we will probably bull flag, and this could mean we see the 0 of that pattern quite soon (around $55.94)
stop loss around 52.89 as this would mean we need a retest of major support.

vix threatening to reverse (UVXY)we are at a critical level in UVXY where oscillators like rsi are making a same low while the price has decreased somewhat.

Market Recap and levels to watch for the coming sessionsMorning Jumpstart Macro View 26-01-22
US markets found some buying early only to give way to selling pressure into the close to close the Indexes in negative territory. FOMC is out late in the coming US session which weighed on the market especially tech (Nasdaq).
For a deeper look at the price action, key levels and what I see playing out...watch the video and feel free to leave any comments.
Thanks for watching and please take some time to check out the website.

we should see a bounce some time in the following week (SPXL)i really want to stress that i am not saying the daily/weekly trend is going to change right back to bull.
with that said, i think there is money to be made long over the next week, as long as futures sunday dont have the craziest bear session since corona.
some shorts are going to cover on the next drop, and this is going to cause a small squeeze.
i dont think all time highs are in the cards yet for broader market bulls. i do think 106 and 119 are reasonable targets. rsi is diverging bullishly, and dipping into the high teens would signal oversold conditions.
i realize this differs from my SPY forecast. that is a long term forecast on an unleveraged asset. i am using different strategies for different instruments.
qqe long entry signal should be due soon, although there have already been 3 signals that only led to small bounces, and not a return to a bull trend since the top.

volatility in the dollar should continue (DXY)fib trend extend says the hourly picture could still be bullish for the dollar, but continued resistance around the 95.8 area, and continued support around the 95.4 area is likely.
this should mean cheaper prices for stocks, but i dont imagine the fed can keep its finger off the printer button for long.
a break above or below the horizontal lines and 4 hr close would be considered bullish or bearish respectively.
favorite USD pairings at the moment for a bull break in DXY would be NZD and AUD, and my favorite dollar pairings for a bear break would be JPY or EUR.

one big reason why i think were due for a bounce (put/call)its not that i think we cant see more puts, but every time weve seen a put/call ratio over 1.2 in the recent past it has been short lived.
my theory is essentially that a lot of assets have seen class specific or weight targeted pullbacks from mostly unexpected spikes that have brought down broader markets with increased levels of puts to calls. as outflows are detected, stocks bleed into a cash hungry marketplace that synergizes losses. this has driven puts into an overbought condition that simply cant last forever. this isnt an indication that were at a bottom in indices, but its likely that shorts will cover soon, and this will squeeze that cash back into portfolios as inflows start to pick up.

Market Recap and levels to watch for the coming sessionsMorning Jumpstart 25-01-22
US Bounced bark hard from a weak open after trapping and squeezing some sellers. Bargain hunters were out in force expecting that the selloff is over and its time to buy the Dip. I feel that we may have seen the highs put in place and may expect a further unwind of bulls as inflation and interest rate rises kick in. More in the video....
Thanks for watching and please take some time to check out the website.

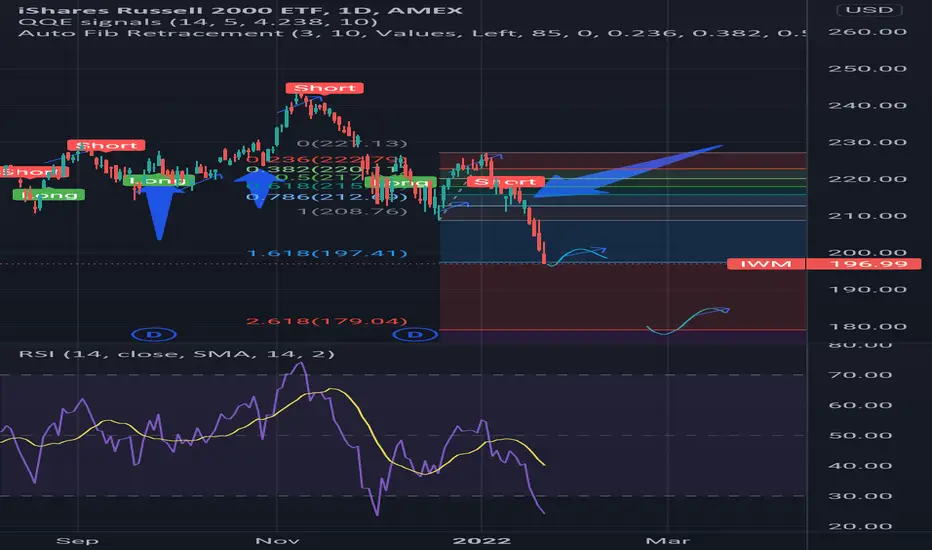
scalpers paradise (IWM)this is purely educational, and not investment advice. get professional advice before investing.
there is nothing more predictable than reversals of the broad trend. take iwm for example. small caps are extremely sensitive to large volume market moves. small caps obey a general ruleset that ties their values and fundamentals to that of larger names and other indices as well as the dollar index.
this doesnt mean small stocks move with the large names that are a much safer passive buy. the david and goliath relationship between businesses of varying internal and market values is nuanced, and unique in the world. the different ways companies keep cash on hand and their comparative debt ratios are like a slip fault. tremors begin in a given epicenter, usually a specific sector or subset of an index or sector, and they radiate out through closely to more distantly related groupings while the broader equities market as well as other asset classes absorb the impact.
depending on how the smaller names are related to those prices, whether its a commodity or corporate bond, currency pair, what have you, the impact can be more or less volatile. impact, be it positive, negative or having a calming/sideways movement, can determine direction and magnitude of a trend (sometimes directly or inversely proportional to the affected grouping) in confirmational bias to the existing trend, or indicate reversal.
it is these reversals that make a scalpers job so easy. avoiding the large part of a move, and only funding a trade during periods of reversal seems like giving up the fort. in reality, this castle keep so to speak adds a consistency and implied judgement to the soundness of a prospect. speculation is essentially eliminated, as the stock is so overextended in its involvement with whatever makes the move as to be an impossibility for the trend to continue.
paying close to the direction of each arrow during a reversal in small caps, youll notice that nothing is pointing down. this is not because you shouldnt short IWM. this is just indicating how your stop loss always trends up, as profit can only realistically be kept in one direction. as the trend changes, and candles either begin to break lows or highs, the pattern of a higher low or lower low every candle on the next timeframe up will begin to break. one can make only long or short trades in either bull or bear case this way and still profit reliably. every small arrow can be a short or long, and this means the movement is far easier to forecast.
entry and exit is determined purely by strict adherence to determined directionality and support or resistance levels. use a computer aided tool for this. dont rely on your own judgements or calculations. stay rigidly latched to your levels so as to trade like a robot would. you can add some padding to precise levels, but it shouldnt exceed a proportional amount to the movement that is changing. always trade on closure below or above certain reversal levels on a larger timeframe indicating a break in the trend and quickly average in as each new candle on a smaller timeframe confirms the break of trend. both directions are valid, so keep tight stop losses to lock in profit. this will mean orders need to happen rapidly. take your time, and pay close attention to things like bid/ask and levels in the order book, but rapidly return to being able to make your next move as opposed to something distracting like news or another chart. order most cost basis at the beginning and average smaller amounts as trends reverse. the fastest part of the trade in oversold bounces/overbought retracements is also the point where the most profit can be lost, so you dont want to take a bigger bite as velocity increases. dont follow the trend after it changes. the point of scalping is that moves are more predictable in smaller sizes. you are capitalizing on the volatility of an asset, not the trend of the movement itself. you will need to use much of your available cash to do this; upwards of 78%. the next move after a reversal can always be a fakeout to second reversal. i have pointed out some fakeouts with larger arrows.
as your junior most assets reach a value that of your sr most assets cost basis, exit the trade. wait patiently for another trend reversal, and take smaller general direction trades in between with a looser stop loss that you can be more relaxed with.
rsi is going to be in the low 20s monday. where do you think this could go?
crossroads for vix (uvxy)we have reached another crossroads for vix, and thus one of my favorite etfs: UVXY.
if we hold mid to high 11s the we could be up at mid 12s by friday
if we keep breaking to new lows today and tommorow then we could be back down in the low 11s by the middle of next week.


Market Recap and levels to watch for the coming sessionUS markets saw a late session beating to push prices sharply lower into the close and continue the recent selloff. Watch the video for a more detailed breakdown on my Macro picture and key levels I am watching in major markets.
Thanks for watching and please take some time to check out the website.

context for the crossroads (uvxy)i just wanted to show people why this could still go very badly for broader market longs.
im not doomsaying, or fear mongering here. im simply outlining why i still have a long forecast for vix, even though we are almost breaking to new lows in uvxy.
the highlighted areas are times in the very recent past where spx has increased in volatility even while indices were on the verge of fully recovering.
again, im not saying long this thing right now. im pointing out how this could still be a bullish position for vix longs even while the market appears to be about to recover fully.
dont jump into uvxy trying to call the bottom, but do stay cautious!
this can still go both ways and tuesday is going to be critical.

S&P500: No Time to Relax 🥵S&P500 has lived through two exhausting weeks, exploring virtually every level of the blue area between 4698 and 4552 points, and lately going below it on its search for a new low. However, there is no time to relax now! We expect the index to finish wave in blue just below the blue area (and allow him a buffer zone only until 4492 points). Then, it should be full of go again. The following surge should slingshot the index up into the upper blue area between 4992 and 5099 points, where the destination of wave in blue should be located.
However, we have worked out an alternative that is not to be sneezed at! There is a 40% chance that the index could initially go further down if it lingers below the support at 4492 points. It shouldn’t fall below 4269 points though. The trend reversal should take place in the lower blue belt between 4399 and 4293 points and ensure a new rise.
All in all, S&P500 should be ready to go up again before touching the support at 4492 points. Still, with a probability of 40%, it could slide below this mark at first.

Stock Index selloff and key levels to watch on major marketsA rally in crude oil triggered more concern into inflation and interest rate rises which saw a stock market selloff. In the video I look through the key levels I am watching on major Indexes, US bonds and the USD.
Thanks for watching and please take some time to check out the website in my profile.

QQQ Put Credit SpreadI believe tech will remain strong, and this trade also has a large margin of error.
Opened for a 0.40 Credit.
Looking at the chart, this trade lines up perfectly with a support zone, in addition QQQ is still trending upwards on a quarterly basis. This is a bit of a reversion trade in the sense that I am taking advantage of the pullback to collect adequate premium at a low delta short strike ( 0.14 or 1.4 STD).
This trade in combination with the XLE trade from yesterday has shifted my portfolio from Delta neutral to a small long market bias.

two ways this can go (spx)since we didnt immediately continue higher, but stopped just shy of getting above fridays close spx has retraced to the .382 of the bounce.
my idea is simple: if we stay above 4638 its likely to bull flag, and if we dont its likely to revisit 4600 around the .786, or at leats the bottom of low anchored vwap around 4616 or the .618
the key will be sector rotation, and if xlf, spy, and qqq are hitting lows at the same time then a decline is more likely. if some sectors and big stocks are doing well while others suffer a little, then rotation and a bullflag in the index is more likely.

spx volatility appears to be returning in a big way (es1!)unfortunately for broader market longs i think we are in for another increase in volatility running into the first part of the new week.
i imagine we have one more run up toward resistance to fakeout the bulls before support fails like it has since the bottom at 10am est on friday.
the current hourly inside bar tells me to set up long toward 4668, but momentum and other indications are saying a decline to 4643 is very likely.

Bank Nifty 15 min TF BREAKOUT AND RESTEST with bullish momentumretest with bullish hammer indicates strength. triangle pattern breakout and restest done entry should be in next 15 min bullish candle

US100 (Free Signal)Happy New Year for you all Newbies Intermediate Expert - I wish you all a blessed and profitable 2022.
I wish you more health , more wisdom , more knowledge , more profits.
Don't forget... trade is your perspective about your own life , never judge anyone , never care about what you dont know.
Be more disciplined , Be more Motivated , Be more Human , Be more YOU.
Gillionaire Global the place where knowledge never die and Numbers never lie

