DAX: Overbought and in need of a technical correction.DAX is almost overbought on the 1D timeframe (RSI = 69.159, MACD = 322.400, ADX = 30.730) and heavily on the 1W (RSI = 76.198), which suggests that the long term trend is massively bullish but on the short term a pull back below the 1D MA50 is needed in order to harmonize the supply and demand equilibrium. The index has already been rejected at the top of the HH Zone, which is a first sign for a potential pullback. Even though in the first two quarters of 2023 it spent considerable time inside this Zone before making a correction (even under the 1D MA200), this time the 'necessity' for a short term correction is greater. We are aiming for the pattern minimum of -6.42% (TP = 17,450).
## If you like our free content follow our profile to get more daily ideas. ##
## Comments and likes are greatly appreciated. ##
Indextrading

What is Dow Theory?The Dow Theory is a financial concept based on a set of ideas from Charles H. Dow‘s writings. Fundamentally, it states that a notable change between bull and bear trend in a stock market will occur when index confirm it.
The trend that is recognized is considered valid when there is strong evidence supporting it. The theory states that if two indicators move in the same way, the primary trend that is identified is genuine.
However, if the two indicators don’t align, then there is no clear trend. This approach mainly focuses on changes in prices and trading volumes. It uses visual representations and compares different indicators to identify and understand trends.
Dow Theory:
The Dow Theory originated from the analysis of market price movements and speculative viewpoints proposed by Charles H. Dow. It served as a fundamental building block for technical analysis, especially in a time when modern software-based technical analysis tools did not exist.
Robert Rhea’s book “The Dow Theory” thoroughly explores the evolution and significance of the theory in speculative endeavours, closely examining the Wall Street Journal editorials written by Charles H. Dow and William Peter Hamilton in the 19th century.
This theory represents one of the earliest efforts to comprehend the market by considering fundamental factors that provide insights into future trends.
The main version of the theory primarily focuses on comparing the closing prices of two averages: the Dow Jones Rail (or Transportation) (DJT) and the Dow Jones Industrial (DJI). The premise was that if one average surpassed a specific level, the other average would eventually follow suit. Dow used an analogy to illustrate this concept, likening the market to the ocean.
He explained that just as waves rise to a certain point on one side of the beach, waves on another part of the beach will eventually reach that same point. Similarly, in the market, different sectors are interconnected, and when one sector shows a particular trend, others tend to follow suit as they are part of a larger whole.
The Paradigms of Dow Theory:
To comprehend the theory, it is essential to grasp the various rules formulated by Dow. These principles, often referred to as the tenets of Dow theory, serve as guiding paradigms
Three major market trends:
The tenets of Dow Theory classify trends based on their duration into primary, secondary, and minor trends. Primary trends can be either upward (uptrend) or downward (downtrend) and can last for months to years.
Secondary trends move in the opposite direction to the primary trend and typically last for weeks or a few months. Minor trends, on the other hand, are considered insignificant variations that occur over a shorter time span, ranging from a few hours to weeks, and are considered less significant than the primary and secondary trends.
Primary trends have three distinct phases:
Bear markets can be divided into three distinct phases: distribution, public participation, and panic.
In the distribution phase, there is a gradual selling off of assets by investors.
The public participation phase occurs when more individual investors start selling their holdings, leading to a broader decline in the market.
The panic phase is characterized by widespread fear and selling pressure, often resulting in a sharp and rapid decline in prices.
On the other hand, bull markets experience three phases: accumulation, public participation, and excess.
During the accumulation phase, astute investors start buying assets at lower prices, anticipating an upward trend.
The public participation phase occurs as more investors join the market and buy assets, contributing to the market’s upward momentum.
The excess phase represents a period of exuberance and speculative buying, often marked by overvaluation and unsustainable price increases.
Stock market discount everything:
Market indexes are highly responsive to various types of information. They can reflect the overall condition of an entity or the economy as a whole.
For example, any significant economic events or problems in company management can impact stock prices and cause movements in the indexes, either upward or downward.
Trend confirms with volume:
When there is an uptrend, trading volume rises and decreases while a downtrend starts
Index confirm each other:
When multiple indices move in a consistent manner, following the same pattern, it indicates the presence of a trend.
This alignment among indices provides a strong signal of market direction. However, when two indices move in opposite directions, it becomes challenging to determine a clear trend. In such cases, conflicting signals make it difficult to deduce a definitive market trend.
Trends continue until solid factors imply the reversal:
Traders should be careful of trend reversals, as they can often be mistaken for secondary trends. To avoid this confusion, Dow advises investors to exercise caution and verify trends with multiple sources before considering it a genuine reversal.
How Does Dow Theory Work in Technical Analysis?
The Dow Theory played a crucial role in the development of technical analysis in the stock market and served as its foundational principle. Which, approach to analysis highlights the importance of closely observing market data to identify trends, reversals, and optimal entry and exit points for maximizing profits.
As the market is considered an indicator of future performance, the application of technical analysis based on the Dow Theory helps investors make profitable trading decisions by identifying established long-term, mid-term, or short-term trends. By using this approach, investors can gain insights into market dynamics and make informed decisions to enhance their trading outcomes.
In conclusion:
The Dow Theory has significantly influenced technical analysis in the stock market, serving as a cornerstone for its development and advancement. By analysing the careful examination of market data, this theory helps traders to identify trends, spot reversals, and determine optimal buy and sell points for maximizing profits.
The market itself is considered a reliable indicator of future performance, and technical analysis aligned with the Dow Theory assists investors in making profitable trading decisions by detecting established long-term, mid-term, or short-term trends. By using this analytical framework, investors can gain valuable insights into market behaviour and make well-informed choices to improve their trading outcomes. The Dow Theory’s enduring impact continues to guide traders in their pursuit of success in the dynamic world of stock market investing.
___________________________
💻📞☎️ always do your research.
💌📫📃 If you have any questions, you can write me in the comments below, and I will answer them.
📊📌❤️And please don't forget to support this idea with your likes and comment

Quick NQ Assessment- Do we remain BullishThinking of a possible trend shift.
Added my thoughts to this video mostly to show myself what I missed today
CME_MINI:NQ1!

DAX: Overbought on 1D and in need of a technical correction.What makes us expect a technical correction this time, is the similarity in terms of RSI with mid February 2023. It took another 3 weeks for the price to decline but not before the RSI completed a Cup and Handle pattern. That was a -8.00% decline, we are aiming from the current levels for a -6.40% decline, which happened another 2 times, so our target is near the S1 level (TP = 16,900).
## If you like our free content follow our profile to get more daily ideas. ##
## Comments and likes are greatly appreciated. ##

🌟📈 Weekly Chart Technical Analysis for IWM! 📊💼Let's delve into the fascinating world of IWM and explore its weekly chart. Get ready for valuable insights and potential trading opportunities. 🚀📈
🔄 Cycle Analysis:
By analyzing the cycles, we've identified a cycle period of 48 weeks for IWM. Interestingly, we've divided each 48-week cycle into three distinct parts, allowing us to pinpoint key moments within the market's trajectory. Let's dive into the current cycle! 🔄📆
📈 Uptrend at 1/3 of the Cycle:
In this new cycle, IWM finds itself right at the 1/3 mark. It successfully broke out of the key resistance level at 190.8 back in December 2023, and this level has been retested, confirming its significance. As a result, we believe IWM is currently experiencing an uptrend. 💪📈
📉✅ Key Levels and Price Range:
Based on our analysis, we anticipate that over the next 32 weeks, IWM will remain within a price range of 203.54 to 228.70. Notably, the upper end of this range, 228.70, is closely aligned with the high reached in November 2021. Additionally, there is a Supply Zone located at 235.50, making this area a crucial zone to monitor. 📉🎯🔍
🔄🔎 Retracement Entry Opportunities:
For traders seeking a long entry, we recommend focusing on retracements within smaller timeframes, such as the H4 or daily chart. These retracements can provide favorable entry points with a potential profit of 12% and a risk-reward ratio of more than 2 to 1. This presents an enticing opportunity for mid-term investments. 🔄💼💰
📚🔍 Conduct Your Own Study:
As always, it's crucial to emphasize the importance of conducting your own research and analysis before making any investment decisions. Stay informed, stay vigilant, and make well-informed choices based on a comprehensive understanding of the market. Knowledge is power! 📚💡💼
Embrace the insights, seize the potential within IWM's weekly chart, and consider the captivating opportunities it presents. Remember, trading carries risks, so always exercise caution and diligence. Let's make the most of these chances and aim for profitable investments! 💪💼💹
#IWM #WeeklyChartAnalysis #UptrendForecast #RetracementEntryOpportunity #MidTermInvestment 📈🔍💱

Mr. Double Top is that you?Following a contracting triangle breakout today, NIFTY zoomed up with a fair amount of pull backs which denote more than just a regular retracement. Over a larger time frame, one can observe NIFTY ultimately forming lower highs since it made the last all time high. Today, near the closing bell NIFTY made a double top and slipped down from what one would consider a healthy retracement. These sharp pull backs show the power of bears to cause a dip and trap for buyers hoping a fresh bull run.
However, patterns can break so keeping in mind the risks you should not stick to any particular pattern assuming the holy grail to market formations. On the right axis is Fibonacci retracements we can observe if a sharp fall occurs if the double top pattern holds true.

S&P500: 1W MACD about to make a Bearish Cross. Huge sell signal.The S&P500 is on the second straight bearish 1W candle and if the week closes this way, it will be the first series of red 1W candles since the October 23rd 2023 bottom. The 1D timeframe has already turned neutral (RSI = 51.449, MACD = 32.820, ADX = 32.340) after a prolonged period inside the overbought territory, so we can claim that a medium term correction has started. A 1W MACD Bearish Cross will confirm it, as it has been the single most major long term sell signal in the past 1.5 years.
The last 1W MACD Bearish Cross was formed after the August 14th 2023 1W candle and the then declined by -8.58% initially to reach the 1W MA50 and then completed a -10.90% decline to form a HL at the bottom of the Channel Up. -8.00% and -9.00% corrections have been common on MACD Bearish Crosses. In any case, this indicates that the S&P500 can drop to 4,650 (-8.00%) in order for the market to see if the 1W MA50 can hold as a long term Support after an incredible 4 month rally.
See how our prior idea has worked out:
## If you like our free content follow our profile to get more daily ideas. ##
## Comments and likes are greatly appreciated. ##

DAX: Market Top is being formed. DAX hit the HH trendline on a bullish 1D technical outlook (RSI = 59.185, MACD = 53.000, ADX = 25.248) but a Bearish Divergence RSI. The 1D CCI is repeating the May 19th-July 31st 2023 successive peak pattern on the HH that eventually corrected first to the 0.382 Fibonacci level and the 1D MA200 and then under the 0.618 Fibonacci level. Consequently, a crossing under the 1D MA50 will be the ideal sell signal to target the S1 level (TP = 16,350).
## If you like our free content follow our profile to get more daily ideas. ##
## Comments and likes are greatly appreciated. ##

DXY / 4H / TECHNICAL ANALYSIS TVC:DXY I have set my goal on the chart.
Like and comment if you find value in our analysis.
Feel free to post your ideas and questions at the comments section.
Good luck

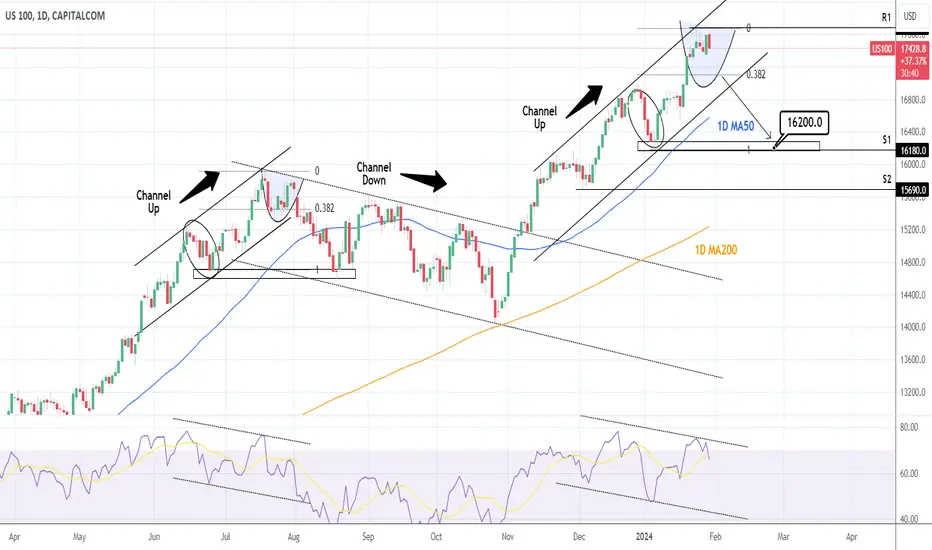
NASDAQ: Is the correction starting?Nasdaq isn't overbought on the 1D time-frame anymore but technically it remains bullish (RSI = 63.538, MACD = 210.050, ADX = 41.826) and will continue to be as long as the two month Channel Up holds. It may be supported by the 1D MA50 but if the index follows the late July peak formation and crosses under the 0.382 Fibonacci level, then we expect a technical short term correction. The crossing will be our sell entry trigger and we will target the S1 level (TP = 16,200).
See how our prior idea has worked out:
## If you like our free content follow our profile to get more daily ideas. ##
## Comments and likes are greatly appreciated. ##
JSE 40 Index | Daily | Speculation Looking at the JSE 40 all-share Index on the daily chart we can take note that the index has been trading downwards since peaking sometime during Feb 23, now looking to the left again we can take note that after the release of the 1st quarter Dividend & Earnings release the JSE drop on both accounts.
Now looking to the right, we can take note that the JSE has been hovering/consolidating on our 8,988 level for the past few days ahead of this weeks CPI, PPI & SARB Interest Rate announcements.
Looking further to our right we can expect the JSE to push up from 8,988 to around 9,843 or 10,017 before heading down to 8,229.
Else we can expect the JSE to just tumble down to 8,229 if it closes below 8,988.
Potential Market Movers:
CPI (MoM) - Apr :: 24 May 2023
PPI (MoM) - Apr :: 25 May 2023
SARB Interest Rates :: 25 May 2023

S&P500: Last rally before correction.S&P500 may be overbought on the 4H timeframe (RSI = 72.835, MACD = 15.590, ADX = 49.520) but not yet on the 1D technical outlook as the price hasn't yet made a HH on the two month Channel Up. The 4H RSI does show us though that it is starting that HH peak sequence as it can start a LH trendline like December 14th. We are expecting this wave to peak on a +5.55% rise at 4,920 like the Higher High of December 27th, where we will short and target the 0.5 Fibonacci level and 4H MA200 (TP = 4,800) like the index did on the January 5th HL.
## If you like our free content follow our profile to get more daily ideas. ##
## Comments and likes are greatly appreciated. ##

DXY - The Leading Index For 2024Hello Traders, welcome to today's analysis of Dollar Index.
--------
Explanation of my chart analysis:
DXY (Dollar Index) has been forming a triple bottom all the way back in 2008 and has been rising ever since. With the recent break above the psychological $100 level, the DXY is once again confirming the bullish strength. If DXY doesn't break below this area, I am targeting new swing highs.
--------
I will only take a trade if all the rules of my strategy are satisfied.
Let me know in the comment section below if you have any questions.
Keep your long term vision.

Breakout in Dow Jones Industrial Average (DJI)...Chart is self explanatory. Levels of breakout, possible up-moves (where stock may find resistances) and support (close below which, setup will be invalidated) are clearly defined.
Disclaimer: This is for demonstration and educational purpose only. This is not buying or selling recommendations. Please consult your financial advisor before taking any trade.

FINNIFTY- Ready for another leg up?Finnifty and all the other indexes reacted very well on BJP's win in the elections.
So what now?
We can't even think about bearish positions now. Going forward for tomorrow's expiry, there are 3 scenarios
1- Gap down opening: If there's a gap down opening which is less than 0.7%, then I expect finnifty to recover and expire either at +-0.2%.
2- Gap up opening: If there's a gap up opening, then I expect finnifty to expire above 20800.
3- Flat opening: If there is a flat opening i expect some consolidation but will expect finnifty to close positive, or at least above 20700.

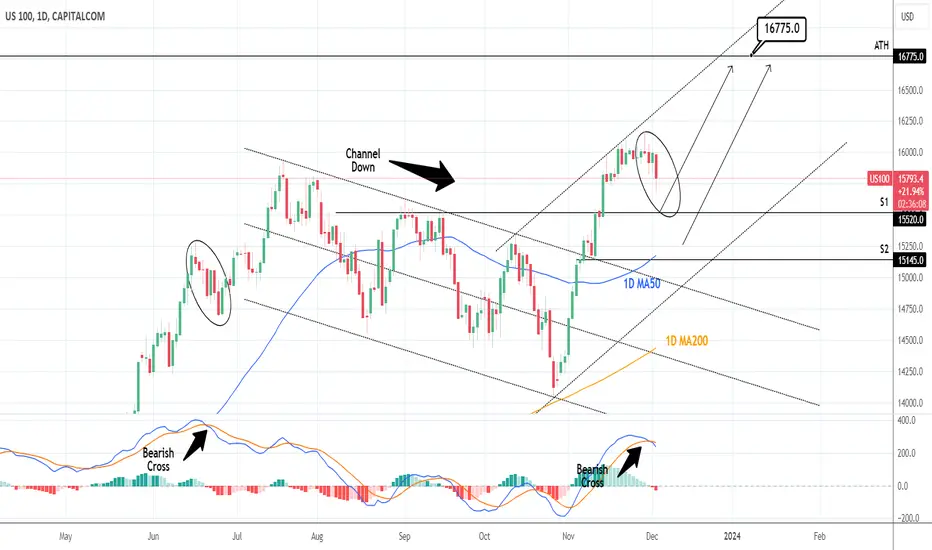
NASDAQ: Healthy pullback serving as end of year rally vessel.Nasdaq is pulling back today after the 1D MACD formed a Bearish Cross and the 1D technical outlook turned neutral (RSI = 54.419, MACD = 183.360, ADX = 45.724). This has so far achieved at offsetting the previous overbought condition on the chart. Technically it can be a HH rejection on a newly emerging Channel Up. This can serve as a buy opportunity either on the S1 level or if it is extended on the S2 and the 1D MA50 for the end of year rally. Our target is the ATH (TP = 16,775).
See how our prior idea has worked:
## If you like our free content follow our profile to get more daily ideas. ##
## Comments and likes are greatly appreciated. ##
BANKNIFTY Trading Near Resistance LevelSince Last Few Days, Banknifty trading in broadening wedge pattern. Currently it's trading near resistance level.
- Downside Fall Rally Can Be possible upto 43000 level if banknifty gives reversal from this level. Based on structure of pattern more chances of downside in banknifty.
- Upside rally only possible if banknifty gives breakout of this resistance zone and sustain above it.
Comment Your View>>

S&P500: Channel Up is holding on 4H.The S&P500 maintains its steady uptrend since the October 27th bottom, inside a Channel Up pattern. This (on a projected +7.15% 2nd bullish wave) targets above the R3 July 27th High (TP = 4,650). Being however overbought on the 4H technical outlook (RSI = 70.276, MACD = 22.060, ADX = 31.456), we will be ready to short if the price crosses under the 4H MA50 and target the 4H MA200 (TP = 4,400).
See how our prior idea has worked:
## If you like our free content follow our profile to get more daily ideas. ##
## Comments and likes are greatly appreciated. ##

Nifty 50 Support and Resistance for Today. TrendX Institute. Levels To Watch Today!
- Nifty bounced between 19,666 and 19,800, closing mid-range.
- BankNifty stayed low, closed near the week's low.
- Levels to watch:
- Nifty: 19,666 (critical),
19,590 (support),
19,800 (resistance)
- BankNifty: 43,500 (support),
43,800 (resistance),
43,300 (possible correction)
No stock updates today.
Have a profitable day!❤️
#Nifty #OptionTrading

📉 Nifty 50 Index: Short Opportunity on the HorizonGreetings, fellow traders!
Today, our focus is on the NSE:NIFTY index. Here's the breakdown:
📈 Upward Movement: The index has been on an upward trajectory, recently approaching the 200-day moving average.
🚨 Near Resistance: However, it's currently near a significant resistance level, suggesting potential selling pressure.
💡 Short Selling Opportunity: I'm eyeing a short opportunity in the range of 19,500 to 19,800 for this index.
📉 Option Buying Strategy: For option buyers, consider 19,800PE or 20,000PE strike prices to capitalize on a potential downward move.
📆 Timing: This bearish outlook is anticipated to unfold in the coming days.
📌 Important Note: Trading involves risks. Make sure to conduct your analysis and manage your risk accordingly.
🤔 Your Strategy: What's your take on the Nifty 50 index? Are you aligning with this short opportunity, or do you have a different perspective? Share your insights!
👋 Until Next Time: Thank you for tuning in. Goodbye for now, and see you in the next post.
Best regards,
Alpha Trading Station

UK100: Thoughts and Analysis Today's focus: UK100
Pattern – LH decline
Support – 7375 - 7250
Resistance – 7466 - 7710
Hi, and thanks for checking out today's update. Today, we are looking at the UK100 on the daily chart.
Today's video asks if the UK100 will continue to move lower after setting up a few beach technical signs. What do you think about the reasons presented in today's video update? Are the lower highs after the trend break and failed rally yesterday a new momentum shift to sellers in the short term?
We continue to look at major index influences and watch today's UK GDP. If buyers are able to reverse today's selling and break the 7466 resistance, this will cancel out this sell idea.
Good trading.

S&P500: This is the strongest rally of the year!S&P500 hit our TP = 4,315 (see chart at the bottom) even earlier than we expected and finally turned bullish on its 1D technical outlook (RSI = 56.977, MACD = -34.150, ADX = 40.157). In the process, it broke above the 1D MA50 for the first time since September 15th.
The wider pattern is a Channel Down now. If the price gets rejected inside the pattern. e.g the R1 level (4,400), we will buy on the pullback to the 1D MA200 and the 0.5 Fibonacci level at 4,270. If it crosses over the top of the Channel Down, we will buy on the next 1D MA50 pullback. In both events, the target is the R3 level (TP = 4,600).
See how well our prior idea has worked:
## If you like our free content follow our profile to get more daily ideas. ##
## Comments and likes are greatly appreciated. ##

DAX: Approaching the 1D MA50. Buy the pullback.Target achieved on DAX (chart at the end) as the price made a straight rebound at the bottom of the Channel Down. The 1D technical outlook is neutral (RSi = 52.756, MACD = -158.600, ADX = 30.783) and being that close to the 1D MA50 without being bullish already, makes a short term pullback possible. On the long term, we expect a bullish breakout over the Channel Down as the current rally originated after an (almost) one month long 1D RSI Bullish Divergence. So as long as the price gets rejected under the 1D MA50, we will wait for a 4H MA50 pullback to open the new long and target the R1 level (TP = 15,575), a candidate to make contact with the 1D MA200 as well.
See how well our prior idea has worked:
## If you like our free content follow our profile to get more daily ideas. ##
## Comments and likes are greatly appreciated. ##
