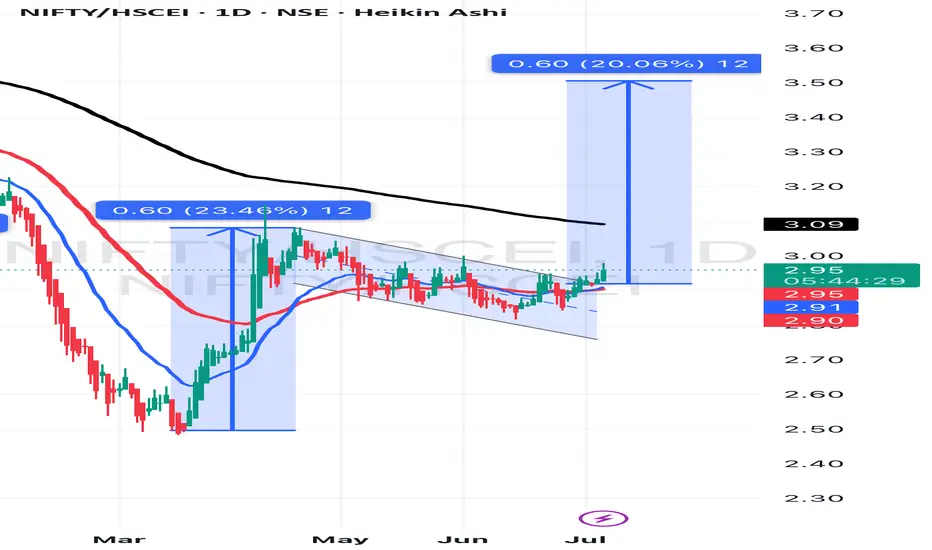
India vs ChinaYear to date, NIFTY has underperformed China - but not recently. Nifty outperformed HSCEI by nearly 20% pts between mid-Mar to mid-Apr and the over the last 2 months, gave back nearly half of these gains! What happened next?
The pullback appears to be a "flag" pattern - typically a bullish continuation - if this breakout holds (stays above 2.9 for NIFTY/HSCEI), Then the measuring implication is a whopping 3.5 - an outperformance of 18-20% pts.
Long Nifty/ HSCEI, currently ay 2.95; stops at 2.85
India
NIFTY 1W forecast until August 2025India's stock market is correcting now. The correction will be short and not deep - just a normal retest of 24,500 but should not make a weekly close below 24,250 during the first half of June 2025.
A major bullrun will start in the middle of June 2025. Slowly at first, but explosive during summer.
It will find its top in August 2025 at the level of 27,800
Here I publish 1W charts, for weekly 1D charts check my profile for more ways to keep in touch

+460% potential profit with TVS MotorThis is my pick for buy&hold in 2025 in NSE India. A part of Nifty Auto Index which will drive its growth and lead the sector.
Strong chart from all angles. This is published as demo of what is available on my social media. You can find more through links in my profile.

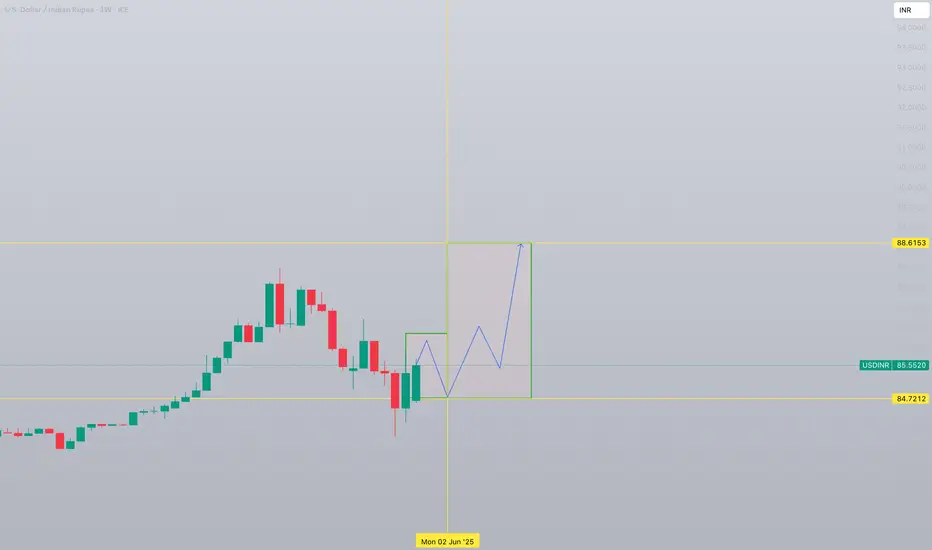
USD/INR 1W forecast until August 2025US Dollar has shown bottom and formed a reversal formation. Current growth will not last long and will find its top at 86.1487 with possible slight overshoot in the second half of May 2025.
This will be followed by second bottoming at 84.7212 in the beginning of June 2025.
Double bottom formation will complete inverted Head&Shoulders and start bullish trend:
- major breakout in the end of June 2025
- with consecutive retest of 85.43 in July 2025
Starting from this level/moment USD will rise fast upto 88.6
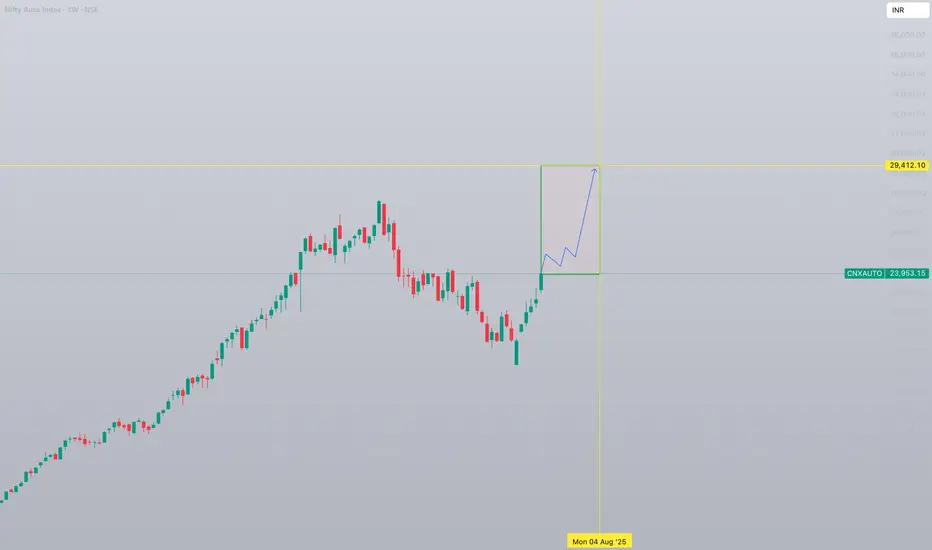
Nifty Auto Index 1W forecast until August 2025NSE Auto Index is in "discharge" mode. This will last until the level of 25000 followed by a sideways-cooldown movement.
Bullish structure will stay intact and the second bullrun will happen shortly.
Major correction/retest will happen after the breakout of previous all-time-high and setting a new ATH with a top at 29,500 in the beginning of August 2025.
TATA Motors India - Trading 680 to 1000Daily chart,
The stock NSE:TATAMOTORS rallied from 535 to 742 since 7 April 2025, and I think a cooling down (minor correction) should take place before resuming the bullish trend.
Expected to test the nearest support around 680
Technical indicator RSI is near the overbought zone. A signal that a correction (downwards or sideways) can be soon.
So, a new entry (Buy) should be in parts after testing the support 685 - 680 and rebounding.
Above 745 for 2 days, the target will be 880 then 1000
Consider the stop loss below 680

IREDA India should target 253.8
Daily chart,
The stock NSE:IREDA has crossed a falling expanding wedge, and the target is 253.8, passing through a strong resistance level at 234.3
However, there is a strong Resistance line R, currently around 172.7
So, after stabilizing above 172.7 for 2 days, the target should be confirmed for a new entry (buy)
Consider a stop loss below 154, and raise the level along with the bullish movement.
Technical indicators:
RSI is forming a bullish direction - positive
MACD is about to cross up the zero line - To be assertive after crossing both the zero line and its signal.

What’s America's Real Goal in a Possible India–Pakistan War?We are nearing the end of the petro-dollar era. The power balance of the new world order will be defined not by oil, but by the strategic resources essential for AI, electric vehicles, and cutting-edge technology.
Throughout the 20th century, the U.S. maintained its global dominance by controlling access to oil. From the Middle East to Latin America and Africa, wherever oil was found, the U.S. was there.
But today, the focus has shifted to rare earth elements, lithium, copper, and other strategic minerals.
Trump’s 2025 move to buy Greenland wasn’t a diplomatic joke—it was a signal. Behind-the-scenes deals in Ukraine for rare earth deposits tell the same story: whoever controls these "white gold" assets will lead the tech-driven world.
Now enters Pakistan, with mineral-rich lands spanning over 600,000 km², nearly three times the size of the UK. Experts estimate its underground reserves to be worth $8 trillion.
In Balochistan's Rekodik field alone, there are 12 million tons of copper and 20 million ounces of gold, with a copper purity of 0.53%, well above global standards. In the north, newly discovered lithium reserves could be a game-changer for the EV revolution.
This is no longer just about resources—this is about deciding the future balance of global power.

Nifty Outlook for next weekNSE:NIFTY1!
Expecting a meltdown on Nifty for the next week, then a rapid push up towards the Buyside

NQ weekly review and Outlook. FOMC week CME_MINI:NQ1!
Expecting buyside expansion on NQ. Lets see how we react in here.

(PERP) perpetual "heightened activity in volume"Perpetual is showing an increase in volume for both sides of the table. This could be a sign of something to come that would otherwise be unexpected by most, perhaps a shot at a higher price. The bulk of activity is found in India 93% right now.

Gold Assignment review and Intraday Reversal Market ProfileGold London consolidation and New York meltdown. Explaining the reasons. And OTE fibonacci levels

Nifty outlooks for next week and overall draw on liquidityExpecting all out bullishness on Nifty 50 Index. 25500+

Gold outlook for next week. Expecting massive bullishnessCrosshairs on $3800. Extremely bullish on gold after this weekly closure

US-China Rift: India's Golden Hour?Heightened trade tensions between the United States and China, characterized by substantial US tariffs on Chinese goods, inadvertently create a favorable environment for India. The significant difference in tariff rates—considerably lower for Indian imports than Chinese ones—positions India as an attractive alternative manufacturing base for corporations seeking to mitigate costs and geopolitical risks when supplying the US market. This tariff advantage presents a unique strategic opening for the Indian economy.
Evidence of this shift is already apparent, with major players like Apple reportedly exploring increased iPhone imports from India and even accelerating shipments ahead of tariff deadlines. This trend extends beyond Apple, as other global electronics manufacturers, including Samsung and potentially even some Chinese firms, evaluate shifting production or export routes through India. Such moves stand to significantly bolster India's "Make in India" initiative and enhance its role within global electronics value chains.
The potential influx of manufacturing activity, investment, and exports translates into substantial tailwinds for India's benchmark Nifty 50 index. Increased economic growth, higher corporate earnings for constituent companies (especially in manufacturing and logistics), greater foreign investment, and positive market sentiment are all likely outcomes. However, realizing this potential requires India to address persistent challenges related to infrastructure, policy stability, and ease of doing business, while also navigating competition from other low-tariff nations and seeking favorable terms in ongoing trade negotiations with the US.

Fool trump BTC@Watch and follow the processBitcoin in the 15-minute time frame seems to have a tendency to rise in the short term
And we are in a range of fluctuation

Nifty Yearly Lows in Place. Time for recovery towards 25000Massive meltdown towards the sellside. Time for all out displacement towards the internal buyside. I feel the yearly lows are in place. Best time to invest for SIP and mutual funds

Infosys Vs Nifty IT The markings on the chart are based on the Elliott Wave theory.
The IT index has lagged in strength over the last 1+ year and now seem to enter the next wave C down. While the index made a new high, the internal moves are corrective and divergent on the RSI which makes it a better wave (B) candidate.
The next few weeks should be a sharp fall in the IT stocks as wave (c) tend to be quick and less time taking.

DELAYED UPLOAD OF PREMARKET ANALYSISDelay Upload of ES and NQ premarket Analysis. We hope its still of value

QUICK LOOK AT A FEW INDICATORS AND INTEREST IN A SERIES?Quick overview testing out the upload from a browser on a ethernet connection computer vs wifi with the desktop downloaded app. Do you find value in this and want to make a regular series? Contact me if so and follow. Esp if your a developer and want to add some videos to your products, free, locked or paid. Im game. Platforms, customization and breaking down analytics is the life. Its what i enjoy and maybe you will too!
Thank you All,
DrawDownKing CME_MINI:ES1!

Omnichart presents - NIFTY/(USDINR) long term trend Nifty's performance when compared to US dollar (vs its base currency i.e. Indian Rupee) broke above a long term since 2007 resistance through Dec 2020. As you can see it broke above the blue line in Dec 2020 and has been outperforming the dollar - to -rupee. What this means is that investing US dollars to buy Nifty started becoming more profitable in Dec 2020 vs just keeping the wealth in US Dollars (not converting to INR). This is in a long term uptrend - what this means is that investing US dollars in NIFTY long term is a profitable strategy.


