BANKNIFTY INTRADAY SHORT and OVERNIGHT LONG SCENARIOS2 possible trades.
1. Intraday short trade on 20 Jan 2023.
Bearish sentiment
Will retest key support level of 40900
Price has just been rejected from 22 EMA on Daily TF
Price will try to approach 200 EMA on Daily TF
2. Overnight long trade on 21 Jan 2023.
Key resistance trendline break
Will try to break through 42000. Conservative target around 41850.
Price will crossover 22 EMA on Daily TF once it gives a daily closing above 41500
India

HDFCBANK - Bearish Cycle HDFCBANK - Elliott Wave Theory.
The price seemed to have made a corrective pattern which suggests another bearish wave. Invalid level remains at the previous high.

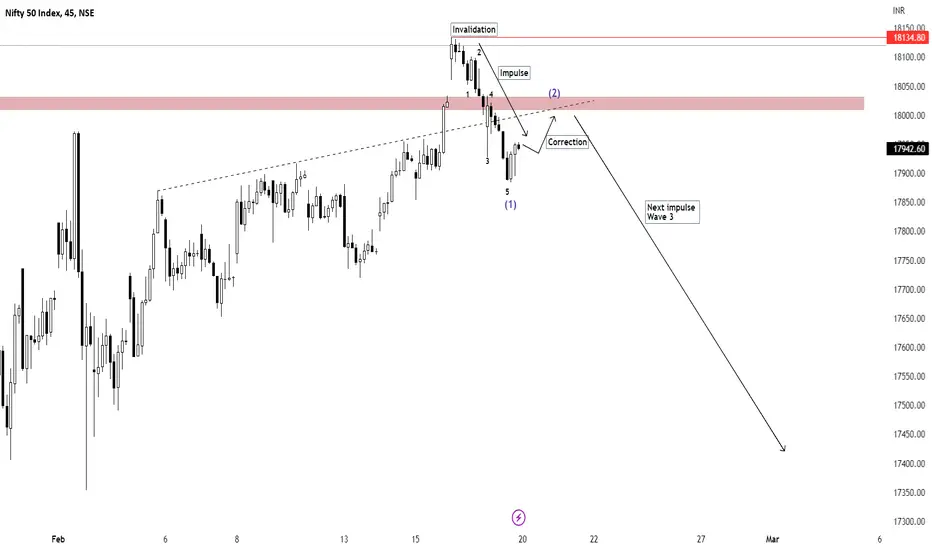
NIFTY - Elliott Wave ViewThe idea is based on the Elliott Wave Theory.
Nifty has made 5 waves down (Impulse 1), and could start moving downwards again after a small correction (50-60%).
Long Term View:
FINNIFTY Upside Expiry TradeInverted HNS pattern on 15M timeframe. Possible upside of around 180-200 points can be captured intraday on 10 Jan 2022.

GOLD correction to RANGE and new EXPANSION!!!The gold market dropped from the resistance zone after breaking out of the range. The market broke and fixed below the smalll range zone. The price is moving toward the main support level at 1800 after making impulse moves. I think gold might go down because the price action forming a correction extension pattern. My goal is the support level at 1802.000.
Traders, if you liked this idea or if you have your own opinion about it, write in the comments. I will be glad

NIFTY - Bearish Market ViewThe idea is based on the Elliott Wave Theory. The current upward momentum is very low and the price is moving in a corrective structure. A downward move is likely from the current resistance zone (or a possible likely scenario with 61.8 fib correction).
A move over 18480 invalidates this idea.

GOLD price action SQUEEZE. Long from strong SUPPORT.The price perfectly fulfills my last ideas. The market is heading toward resistance zone from the strong support level . The price is squeezed by descending triangle pattern and the price might bounced off it and go up to test the resistance zone . I think gold might go up if price action breaks out of the triangle pattern . My goal is the resistance at 1865.

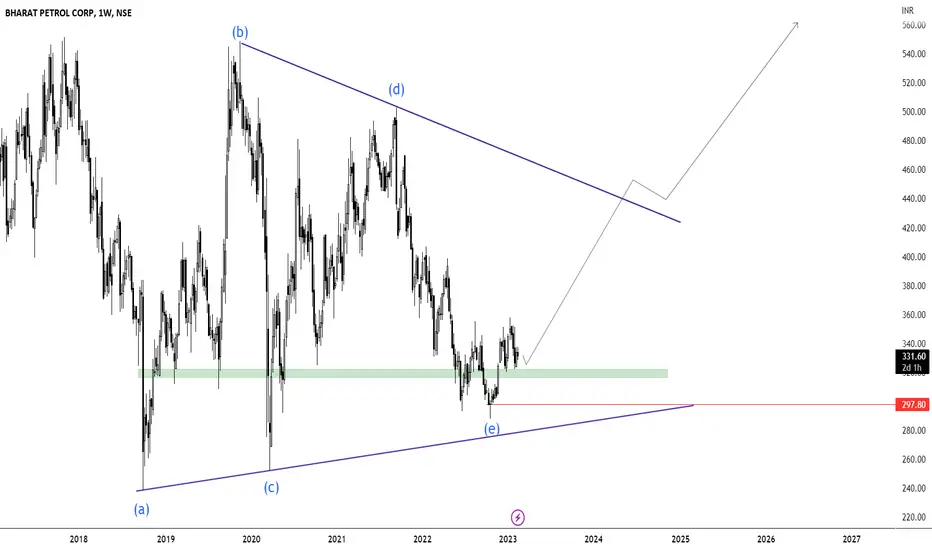
BPCL - Bullish CycleBPCL - Elliott Wave View.
Pattern suggests a triangle formation, which means a bullish scenario is likely from this level. A move below 300 would be an invalidation to this idea.
MRF - Elliott Wave ViewMRF - Daily Chart based on the Elliott Wave Theory.
As long as the triangle stands valid, the price should correct more downwards. Correction could make further extensions if the next resistance level is broken.

NIFTY ANALYSIS - 13/02/2023Buy Above - 17900
SL - 17870
Targets - 17930,17960,18000
Sell Below - 17830
SL - 17860
Targets - 17800,17760,17720
Trade Safe & Happy Trading Guys

GOLD INR: BUYGold in INR terms touched an all time high this month.
The chart patters indicate that an explosive move is going to play out.
Cup & Handle also points to a Year end target of Rs 61,000.

TATA Consumer ProductsThe idea is based on the Elliott Wave Theory. The price is still correcting and will extend to 100% of wave X to 595. Below that level, further extension could be towards 450-470.

BioconBio - CON
Broken the long term ( 14 years) Up sloping Channel
Broken the ST term ( 3 years) downward Channel
Possible H&S
Momentum Indicators bearish

KOTAK MAHINDRA BANKThe stock is currently making a corrective structure and is likely to extend further to at least 61.8 fib. level. 1500 may be a good level to watch; below that we could also see 1420.
This is based on the Elliott Wave Theory.

RELIANCE - Elliott Wave ViewRELIANCE.
Correction cycle towards 1900 level. Below 1850, could extend towards 1650 level. The stock is forming a WXY corrective pattern.
The analysis is based on the Elliott Wave Theory.

Nifty short term target - 17148, 16800, 16650 Nifty chart has recently broken upward parallel channel (white) and taken support at 200 day EMA.. It has also formed a bear flag. Chart patterns suggest we're looking for a downward momentum short term.
My short term targets are 17148 (Fib measured move), 16800 to 16650 (multi month support zone).
If the 16500 levels get broke NIFTY will test 16049 (gap fill) and 15431 (previous month lows).
Let me know your thoughts in comments.

BANK NIFTY ANALYSIS - 31/01/2023Buy Above - 40440
SL - 40380
Targets - 40520,40600,40720,40860,40940
Sell Below - 40240
SL - 40320
Targets - 40180,40100,40020,39860,39720,39600
Trade Safe & HAPPY TRADING GUYS

Adani Ports: BUY @ 62015 year Chart
In a UP trend Channel.
Great Assets, So Fundamentally and Technically a great company.
Inspite of whats going on, come back and re visit this post after amonth !!!

Make or break for Smallcap shares...My view is bearish as samllcap index is forming a rounding top pattern. Unless it negates the pattern, BUY ONLY selected strength stocks in momentum.

Midcaps looks stronger than smallcap.Look for opportunities in Midcap.
RSI Divergence played In midcap and is now sideways.
In Sideways market you can plan both Long and Short trades.

Intraday short for target of 18000Markets are looking weak, for initial target of 18k one could short, if downside continues will update the target.


13 january bank niftyWhen market gap up opening so market still down otherwise opening seam precise so I thinking market was green but most probability market gone up said becose market creact cup and handle pattan
note the leval
