India
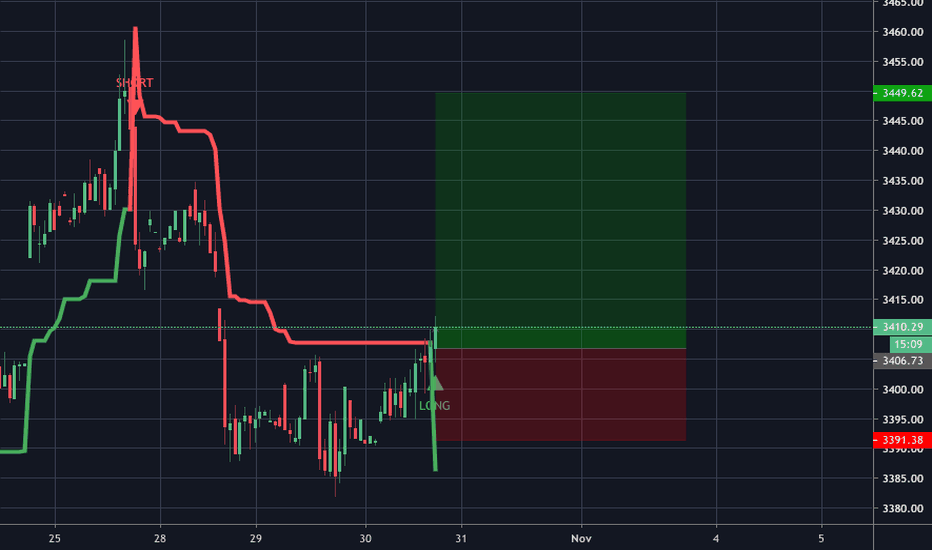
HDFC LONG MONTHLY LOOKS BULLISH HDFC LONG 1:4 TRADE
MONTHLY LOOKS BULLISH
DAILY IS CONSOLIDATING WELL
India is on the verge of collapsingFUD & HOPES all mixed up, not just changing every week now.
On a daily basis.
Different sources even say opposite things.
Trade war & HKG good or bad news on the same day.
No direction it's all coinflip.
India has a weaker rupee and a weak industrial output.
So a catalyst to reverse. There is enough FUD to sell.
Maybe US indices push it higher, I am long DJI.
If DJI pullsback Nifty should too and I'll get money there.
No call on the Nifty or India long term.
Indian stock market acting strong...The indian stock market index is at the brink of breaking out massively here, in this currency adjusted chart. If it manages to move over this trendline resistance it can confirm a quarterly timeframe trend pointing to a large advance in the coming 12 quarters, as shown on chart. Emerging market stocks become interesting with potential weakness in the dollar going forward, and rising oil prices. The big slump in energy prices certainly helps equities going forward, with a delated effect, as explained by @timwest in his publications, since transportation and energy are one of the key inputs of the economy.
I'd keep an eye on it and look for good valuation indian companies, if there's a breakout in this chart.
Cheers,
Ivan Labrie.
Azure looking long first target 11%Strong earnings, PPA's signed with a further commitment of 1.5/GW. 2019 net profit was over USD 2 Billion with net earnings attritbutable to equity share holders was over USD 1.1 billion. A combined portfolio of over 3.5 GW; therefore earnings will be accelerated.
SP500 - 3045 followed by retraceBy looking at the weekly and applying a Fibonacci measured from the pre-2008 crash into the 2009 low, we can create future price targets.
Isn't math neat? ;)
You can see the 1.618 level held as strong resistance before finally breaking through upon Trump's sweeping electoral victory.
The next target is 2.618 or roughly 3040.
Indicators are bullish and prices are already at all time highs but not quite to 3k. More room to run.
We could see a slow melt up to 3000 before pulling back.
Positional Trade - 7.5R opportunity on #TATAMTRDVR #Stock - Bounce from Support
- Breakout & Retest of falling Down Trendline confirmed
- SL / invalidation level 1ATR below recent LOWs.
Short or Long will fill your pocket on TVSMOTOR?On the daily chart, Total 3 patterns have been plotted by this TVS MOTOR which is following,
Two-Channel Patterns
Flag pattern
The Price rotation and Tails are important roles to identify the change in it. Presently, the stock price is in a channel with the supply line, therefore we are expected Tail or Overlapping at the value high.
Focus on volume, the volume is rising with a price. If the volume will continue to raise then, we can see up-break out with targets 498-505 but the resistance 463-468 for short sellers and profiting for targets 428-411.
We are seeing an excess at the demand line from which can be certain that a small excess can be found on the supply line.
Resistance for TVS motors between 466-472 range. If anything does not change fundamentally due to this and next week, this stock will take reversal toward 418-400.
The following patterns have been found,
Triangle (Projected Triangle with breakout point)
Channel from long-term
We are seeing an excess at the demand line from which can be certain that a small excess can be found on the supply line .
Resistance for TVS motors between 469-472 range . If anything does not change fundamentally due to this and next week, this stock will take reversal toward 418-400.


