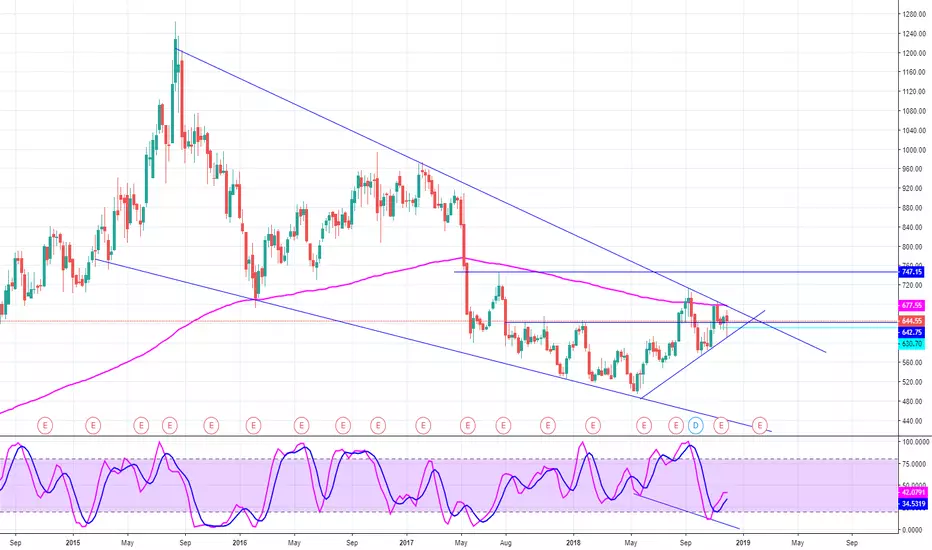
Divis Laboratories Ltd Technical Analysis Indian Stocks Market Divis Laboratories Ltd Technical Analysis Indian Stocks Market
Divis Laboratories is engaged in the manufacture of Active Pharmaceutical ingredients (APIs), Intermediates and Nutraceutical ingredients with predominance in exports. In addition to generic business, the company, through its Custom synthesis business, supports innovator pharma companies for their patented products business right from gram scale requirements for clinical trials to launch as well as late life cycle management.
Indianmarket

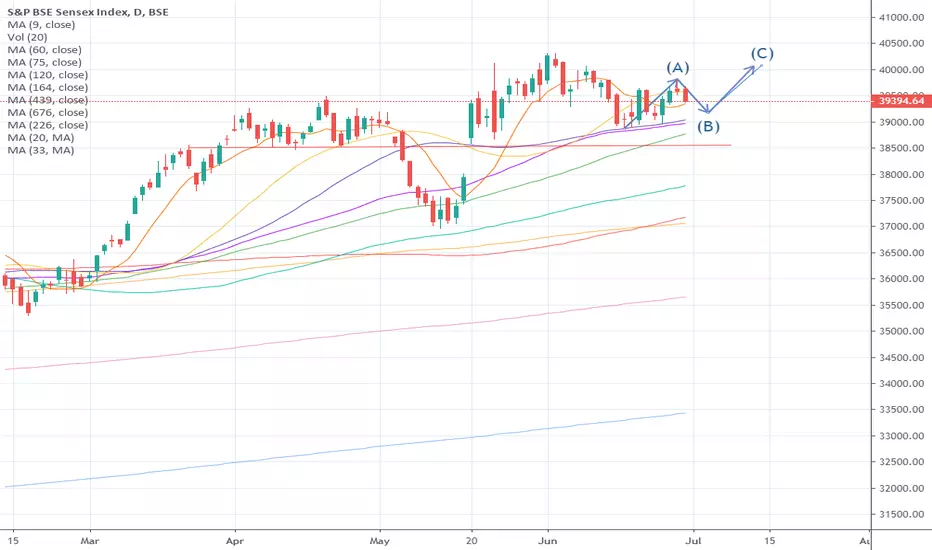
Daily India SENSEX stock market index forecast timing analysis 27-Jun
Price Forecast timing analysis by pretiming algorithm of Supply-Demand strength
Investing position about Supply-Demand(S&D) strength: In Rising section of high profit & low risk
Supply-Demand(S&D) strength Trend Analysis: About to begin an adjustment trend as a upward trend gradually gives way to a slowdown in rises and falling fluctuations
Today's S&D strength Flow: Supply-Demand strength has changed from a strong buying flow to a suddenly strengthening selling flow.
read more: www.pretiming.com
D+1 Candlestick Color forecast: RED Candlestick
%D+1 Range forecast: 0.1% (HIGH) ~ -0.9% (LOW), -0.4% (CLOSE)
%AVG in case of rising: 0.9% (HIGH) ~ -0.2% (LOW), 0.6% (CLOSE)
%AVG in case of falling: 0.5% (HIGH) ~ -0.7% (LOW), -0.3% (CLOSE)
Price Forecast timing is analyzed based on pretiming algorithm of Supply-Demand(S&D) strength.
TCS trading on indecision PointTripple top and made a rounding top. Tripple top is an indication for a bearish move and rounding top is bullish. so clearly TCS is trading on indecision Point.
Book profit if you were in long and wait for a clear move for short term swing

Nifty to 33k+ by 2021Nifty to 33k+ by 2021
Its a good time to invest pick good quality stocks now for 3x-5x Returns..

Nifty: Medium term Buy Opportunity. 12,500 eyed.Nifty is coming off a strong rebound just above the 1D MA200. 1D is on excellent bullish levels (RSI = 62.784, MACD = 111.840, Highs/Lows = 244.5718) having just crossed into new All Time Highs. With the Golden Cross taking place on March 15, we have a strong medium term buy signal towards 12,500.
** If you like our free content follow our profile (www.tradingview.com) to get more daily ideas. **
Comments and likes are greatly appreciated.

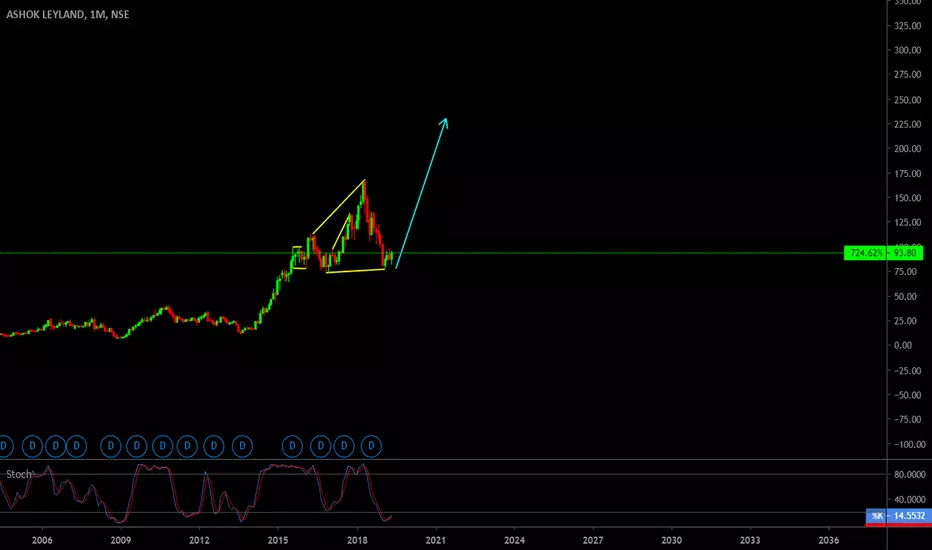
buy ashok leylandcorrective pattern looks completer. expecting an upswing move.
trade with care. thanks
Trouble ahead in the Indian marketsThe Indian Markets are hardly every the topic of discussion on Tradingview. Most people look mainly for the DJI - cuz 'America is great'. For me, it don't matter; wherever there is an opportunity I'll pay attention. The Indian Market is in a precarious position right now.
I see some sort of expanding upward wedge. This can create probabilities for the north or for the south. More times than not my experience is that I've seen price collapse. The upper edges of these wedges suggest that price struggles to get there and is beaten back.

Reverse Head & Shoulders on NSE:CGPOWER DailyThere is a reverse head and shoulders pattern forming for NSE: CGPOWER currently making a low of right shoulder. This would be confirmed when the right shoulder reverses at the neck line.

Nifty: Cyclical short opportunity.Nifty has just been rejected on the 11,760 1M Resistance after a relentless bullish run since mid February. It appears that since March 2018 the index follows an identical repetitive pattern, within the 11,760 1M Resistance and the 9,960 1M Support. Every time the index has rebounded on the 9,960 1M Support, a 1D Channel Up follows, which practically gives way to the aggressive bull run towards the 11,760 1M Resistance.
We expect a similar price action and our first target is the Gap Fill (eclipse) at 11,180.
** If you like our free content follow our profile (www.tradingview.com) to get more daily ideas. **
Comments and likes are greatly appreciated.

USDINR testing 3 month long supportHi trading view members.
Thanks for interactions on my last post.
USDINR is testing 3 month long support. Looking at elections and political situation, I predict that #USDINR will oscillate in the 69 to 69.6 range.
Rebound trend expected around early End march to April.

The Indians could be in trouble again. The India50 is not one that's often talked about. I show how I estimate the price action and probabilities for a short position. As always if anybody is getting into this, prepare to lose! This is a loser's game - we can't win without losing, end of story.

AMBUJA CEMENT FORMING PENNANT PATTERNHello all,
Ambuja is currently under in pennant pattern which is a bullish breakout pattern. Confirmation level is above than 225.

Will the Indians roll over?The Indian stock market is not one I usually see talked about on Tradingview. However, it has been ripening for a short over the last few weeks. Markets decide their own course. Generally though the India50 appears to be weakening.

NIFTY 50 : Elliott Wave Analysis - Perfect fib verified countIn continuation to my previous idea on a larger timeframe:

Possible long opportunity on - EURUSD Have been rolling down for about 180 pips. Aiming to retrace at least 50% taking support on trend line.
Entry now or with confirmations.

ITC, NSE _ Possible long opportunityPrice taking support on EMA and trendline forming double bottom. Entry now or wait for the confirmation.


Glenmark - Ready to fly?Glenmark is sitting on right positions. There is 2 things consider to be Notice.
1- Falling Wedge in a week time frame. It's a bullish breakout pattern We just need to wait for the confirmation only.
2- Second is there is the idden bullish divergence which is also a bullish pattern..

Buy ACC Above 1500ACC may re-enter it's long term channel trend after having filled the big gap formed after the excellent results. A close above 1495 should be positive

AJANTA PHARMA: What Should You Do?This stock is at a very crucial level. Having already formed a major Head & Shoulders pattern, stock may again form an internal H&S if it retraces from here and we may see great falls. However this is just a possibility and if it manages to cross 1175 on closing with volume, stock may give upside move towards 1300. Stay alert and pick the right side!

NIFTY 50, Head And Shoulder formation is in Process.Hi Guys,
The current scenario for NIFTY 50 doesn't look good at all.
1. Let's talk about recent one, you can clearly see that it formed a Bearish Engulfing candle on the weekly chart.
2. There is a Head And Shoulder pattern formation is in the process, which is most likely to complete in December.
3. If you look at the Retracement Levels, You can see that it can't even touch the 50% level which is clearly the sign of weakness.
Targets: If it is able to complete the head and shoulder and breaks below 9950 then the key levels to watch for:
1: 9050(Fibonacci Extension level 1)
2: 8000(1.618 extension level)

Bank Nifty updates for next 5-6 monthsHi Guys,
Looking at the current scenario, the situation doesn't look good bank nifty can easily slip at 23500-23800 levels from here which is pretty much likely and if doesn't stop there it is going to slip to 20000-20500 levels where it has a strong support level. On the upside it has a huge resistance around 26000-26200 level, so to move upside it has to break that level which will open the door for the upside trades.
Looking at the recent weekly candle, which is quite bearish it can easily fall around the 23500-23800 where it has some support.
