Rolex Rings Ready for Takeoff: Long Trade Targets ₹2741!Rolex Rings on the 4-hour timeframe is presenting a fresh long trade opportunity, with the price currently hovering around the entry level. This setup, identified using the Risological Swing Trading Indicator, is primed for a strong upward move targeting 2741.60 at TP4.
Rolex Rings Key Levels:
TP1: 2267.90
TP2: 2448.85
TP3: 2629.80
TP4: 2741.60
Technical Analysis:
The entry price is set at 2156.05, with a stop-loss at 2065.55, ensuring effective risk management.
The price recently broke through a significant resistance zone, signaling bullish momentum. With the Risological trend line confirming the upward bias, this trade setup offers a high-reward opportunity for traders looking to capitalize on the next potential rally.
Namaste!
Indianstockmarket

DELHIVERY INTRADAY TARGETS DONE!Delhivery on the 15-minute timeframe delivered a stellar intraday performance, achieving all predefined targets with precision. This long trade was executed using the Risological Swing Trading Indicator , ensuring a well-timed entry and a disciplined approach.
Delhivery Key Levels:
TP1: 340.80 ✅
TP2: 346.20 ✅
TP3: 351.60 ✅
TP4: 354.90 ✅
Delhivery Technical Analysis:
The trade was initiated at an entry price of 337.45, with a stop-loss positioned at 334.75 to limit downside risk.
Delhivery exhibited strong bullish momentum, crossing the Risological trend line early in the session.
The stock maintained upward movement, achieving all take-profit levels in this intraday trade. This setup highlights the power of the Risological indicator in capturing quick and profitable opportunities in volatile markets.
All the best and do follow me for more success stories, insights, tips and profitable stock calls.
Namaste!

ITI Hits TP1! Target ₹450—Daily Chart Breakout!Indian Telephone Industries (ITI) on the daily timeframe has achieved TP1 and shows strong bullish momentum, making it highly probable to achieve TP2, TP3, and TP4. This trade was identified using the Risological Swing Trading Indicator , providing clear entry, stop-loss, and target levels.
Key Levels:
TP1: 301.40 ✅
TP2: 357.90 (Pending)
TP3: 414.40 (Pending)
TP4: 449.30 (Pending)
Technical Analysis:
The trade entry at 266.50 was confirmed with a breakout above key resistance levels, supported by bullish price action. The stop-loss is tightly placed at 238.25, ensuring risk is well managed. The current upward trajectory aligns with the Risological trend, signaling strong continuation toward the upper targets.
Traders should monitor the price action near TP2 and TP3 for any signs of consolidation or resistance, with the expectation of further upside potential.

nifty | 3rd Dec'202415m: Watch for a buy-side liquidity sweep, then await bearish confirmation to short.
Note: The overall 15m trend is bullish, but price is at a strong resistance and supply zone. If above case fails, expect an aggressive sell-side liquidity grab followed by a bullish move.

Banknifty | 3rd Dec'20243m: Price at strong resistance; wait for bearish confirmation after a nearby buy-side liquidity sweep to short.
15m: If 3m shows no bearish confirmation, watch for a buy-side liquidity sweep on 15m, then await bearish confirmation to short.
*Remember overall 15m trend is bearish!

nifty forecast for 2nd Dec'2024Market may grab sell-side liquidity, create an inducement, target buy-side liquidity, and then turn bearish.

CreditAccess Grameen: Making a Difference in Microfinance◉ Abstarct
The Indian microfinance sector has grown significantly, reaching a total loan amount of about ₹4.33 lakh crore (around $52 billion) by March 2024, which is a 24.5% increase from the previous year. CreditAccess Grameen Limited plays a vital role by providing loans mainly to low-income women, helping them improve their lives.
The company saw an 11.8% growth in its total assets and a 20.8% rise in net interest income for the second quarter of FY25. Despite facing challenges like high-interest rates and regulatory pressures, it expects continued growth due to favorable rural conditions and technology improvements. Lower interest rates in the future could also boost profits and share prices for microfinance institutions like CreditAccess Grameen.
Read full analysis here..........
◉ Introduction
The Indian microfinance sector has evolved significantly over the past five decades, becoming a crucial component of the country's financial landscape. Here’s an overview of its current status, growth trajectory, challenges, and impact.
◉ Current Status
● Market Size: As of March 31, 2024, the microfinance industry boasts a gross loan portfolio of approximately ₹4.33 lakh crore (around $52 billion), marking a year-on-year growth of 24.5%. This growth underscores the sector's resilience and capacity to adapt to changing economic conditions.
● Customer Base: The sector serves around 78 million customers, with a notable increase in clientele from rural and semi-urban areas. This demographic shift reflects the sector's commitment to enhancing financial inclusion.
● Institutional Landscape: The microfinance sector comprises 168 Micro Finance Institutions (MFIs) operating across various states and union territories, with non-banking financial companies (NBFCs) leading the market with a share of 39.1%, compared to traditional banks at 33.5% as of FY23.
◉ Growth Drivers
● Regulatory Framework: The introduction of favourable regulations by the Reserve Bank of India (RBI) has facilitated growth by allowing MFIs greater flexibility in setting interest rates and expanding their lending capabilities. The establishment of MUDRA Bank has also played a pivotal role in financing small businesses.
● Technological Advancements: The integration of technology in operations has improved efficiency and customer outreach, enabling MFIs to serve a larger client base effectively.
● Government Initiatives: Programs aimed at promoting women's entrepreneurship and financial literacy have bolstered the sector's growth. Initiatives such as the Pradhan Mantri Mahila Shakti Kendra aim to empower women through easier access to credit.
◉ Impact of Monetary Policy Decisions on Microfinance
● Interest Rates: Changes in the repo rate influence borrowing costs for microfinance institutions (MFIs). Lower rates reduce loan costs for borrowers, promoting demand for microfinance products.
● Access to Credit: Relaxed monetary policy improves liquidity, encouraging banks to lend to MFIs, which enhances their ability to provide loans to underserved populations.
● Economic Activity: Lower interest rates stimulate economic growth, improving borrowers' repayment capacity and reducing default rates.
◉ Key Players in the Microfinance Sector
Several prominent companies operate within the Indian microfinance landscape:
1. Ujjivan Financial Services Limited: A major player that transitioned into banking with Ujjivan Small Finance Bank, focusing on serving unbanked populations.
2. Bandhan Bank: Initially a microfinance institution, it became a bank in 2015 and provides a variety of financial products aimed at rural and semi-urban areas.
3. Bharat Financial Inclusion Limited (BFIL): Formerly known as SKS Microfinance, BFIL offers microcredit services across India and emphasizes empowering women entrepreneurs.
4. CreditAccess Grameen Limited: This institution focuses on providing loans to low-income households and has established a strong presence in rural regions.
5. Spandana Sphoorty Financial Ltd.: An NBFC-MFI that provides various financial services to economically disadvantaged individuals.
6. Arohan Financial Services Limited: Offers microfinance solutions and is part of the Aavishkaar-Intellecap Group.
Other notable players include Utkarsh Small Finance Bank , Share Microfin Limited , Muthoot Microfin Limited , and Satin Creditcare Network Limited , all contributing to the sector's growth through innovative financial products tailored for low-income clients
◉ Challenges Facing the Sector
Despite its growth trajectory, the Indian microfinance sector faces several challenges:
● Over-Indebtedness: Many borrowers struggle with high-interest rates and multiple loans from different MFIs, leading to financial stress.
● Regulatory Compliance: The sector is subject to strict regulations imposed by the Reserve Bank of India (RBI), which can affect operational flexibility.
● Financial Literacy: Low levels of financial literacy among borrowers can hinder effective utilization of microfinance services
In this in-depth analysis, we'll explore CreditAccess Grameen's market positioning and competitive dynamics, shedding light on its remarkable impact in India's microfinance landscape
◉ Company Overview
CreditAccess Grameen Limited NSE:CREDITACC , a leading non-banking financial company, provides microfinance services to women from low-income households in India. The company offers microcredit loans for income generation, home improvement, and emergency needs, as well as insurance services, retail finance loans, and digital lending products. Incorporated in 1991 and headquartered in Bengaluru, India, CreditAccess Grameen Limited operates as a subsidiary of CreditAccess India BV. Formerly known as Grameen Koota Financial Services Private Limited, the company was renamed in January 2018.
◉ Market Capitalization - ₹ 15,608 Cr.
◉ Investment Advice
💡 Buy CreditAccess Grameen NSE:CREDITACC
● Buy Range - 950 - 970
● Sell Target - 1280 - 1300
● Potential Return - 30% - 35%
● Approx Holding Period - 12-14 months
◉ Q2 FY25 Earnings Performance Summary
● Total AUM Growth: Increased by 11.8% year-over-year, reaching INR 25,133 Crore.
● Gross Loan Portfolio (GL): Rose by 9.3% year-over-year to INR 24,188 Crore.
● Retail Finance (RF) Portfolio: Demonstrated strong growth with an AUM of INR 945 Crore.
● Customer Base: Grew by 7.2% year-over-year to 49.33 Lakh, with the addition of 1.46 Lakh new customers in Q2 FY25.
● Branch Network: Expanded to 2,031 branches across 398 districts, adding 55 new branches during the quarter.
◉ Financial Highlights
● Net Interest Income (NII): Increased by 20.8% year-over-year to INR 933 Crore.
● Cost of Borrowings: Average cost remained stable at 9.8%, with a marginal cost of 9.4%.
● Portfolio Yield: Held steady at 21.1%, with an interest spread of 11.4%, among the lowest in the microfinance sector.
● Net Interest Margin (NIM): Improved to 13.5%, up from 13.0% in Q1 FY25.
● Cost-to-Income Ratio: Reported at 30.7%; Pre-Provisioning Operating Profit (PPOP) grew by 19.5% year-over-year to INR 672 Crore.
● Profit After Tax (PAT): Recorded at INR 186 Crore for Q2 FY25, with a Return on Assets (ROA) of 2.7% and a Return on Equity (ROE) of 10.7%.
◉ Asset Quality Update
A temporary rise in delinquency attributed to:
● Interventions by third parties impacting repayment capabilities.
● Liquidity and cash flow challenges experienced by customers.
● Income fluctuations for agricultural laborers due to adverse weather conditions.
◉ NPA Status Overview
● As of September 2024, preliminary data indicates a slight uptick in NPAs with a gross NPA ratio of 2.44% and a net NPA ratio of 0.76%. This change may reflect broader economic conditions or specific challenges faced by borrowers in the microfinance segment.
◉ FY25 Performance Guidance
● Loan portfolio growth expected at 8-12%.
● NIM forecasted at 12.8-13.0%.
● Credit cost guidance at 4.5-5.0%.
● ROA projected at 3.0-3.5%, ROE at 12.0-14.0%.
◉ Management Confidence
Management is confident that the ongoing delinquency cycle will be short-term, stabilizing by Q3 FY25. Looking ahead, the company expects to gain momentum in Q4 FY25, fueled by favourable rural economic conditions.
◉ Technical Aspects
● After hitting an all-time peak of 1,780, the stock plummeted 50%.
● Currently, it's staging a recovery from the long-term trendline support, with substantial upside potential.
◉ Conclusion
CreditAccess Grameen is well-positioned for substantial growth, driven by increasing demand for financial services among low-income groups, ongoing government support, and advancements in digital technology. The company's strong financial foundation will enable it to capitalize on these trends.
Furthermore, the current high interest rates are expected to decrease soon, leading to lower borrowing costs for microfinance institutions (MFIs) like CreditAccess Grameen. This reduction in borrowing costs will likely enhance profitability, which in turn may positively impact the company's share price, driving it to higher levels.

Buy Krsnaa Diagnostics Short Term Trading Advice by Goodluck Capital
Buy Krsnaa Diagnostics
Buy Range- 980 - 1010
Target- 1050 - 1065
StopLoss- below 944
Potential Return- 6-8%
Approx trade duration 12 - 14 days

Indo Count Industries: Stitching Together a Sustainable Future◉ Abstract
Indo Count Industries Ltd., a leading Indian home textile manufacturer, has reported significant growth, with FY24 revenue reaching ₹3,557 crore, an 18% increase year-over-year. Despite supply chain challenges and a decline in sales volume, the company remains optimistic about future growth, driven by strong demand and strategic initiatives. The company’s focus on sustainability and strategic acquisitions has further strengthened its position.
Currently trading at a P/E ratio of 20.3, below the industry average, Indo Count appears fairly valued. Increasing institutional interest indicates growing confidence in the company’s long-term potential. As Indo Count continues to prioritize operational efficiency and market expansion, its future growth prospects remain promising.
Read full analysis here.........
◉ Introduction
The US bed and bath linen market is projected to experience significant growth in the coming years. As of 2024, the market size is estimated at approximately $10.73 billion, with expectations to reach $13.14 billion by 2029, reflecting a compound annual growth rate (CAGR) of 4.14% during this period.
This growth is driven by several factors, including:
1.Increased Homeownership: Rising homeownership rates are boosting demand for essential bed and bath linens like sheets and towels.
2.Consumer Spending: Higher disposable incomes are leading to increased spending on home furnishings, including premium and luxury linen products.
3.Sustainability Trends: There is a growing consumer preference for eco-friendly and sustainable products, influencing purchasing decisions in the bed and bath linen segment.
The market is characterized by a low concentration of major players, indicating a competitive landscape with numerous brands catering to various consumer preferences.
◉ Major Players in the Industry
Several key players dominate the US bed and bath linen market:
1.Indo Count Industries Ltd.: As the largest manufacturer of home textile bed linens globally, Indo Count is a significant player in the US market, known for its extensive product range and commitment to sustainability.
2.Brooklinen: This brand offers modern and luxurious bedding products, appealing to consumers seeking comfort and style.
3.Peacock Alley: Known for its premium quality and craftsmanship, Peacock Alley focuses on high-end bed and bath linens.
4.Crane & Canopy: This company provides stylish yet affordable options for a wide range of consumers.
5.Tempur Sealy International, Inc.: A leading player in the bedding industry, known for its innovative mattress solutions that complement bed linen offerings.
6.American Textile Company: Offers a variety of bedding products with a focus on quality and comfort.
Today, we'll take an in-depth look at Indo count Industries, a prominent player in the US bed linen manufacturing sector, exploring its market positioning and competitive dynamics.
This detailed report undertakes a thorough evaluation of ICIL's technical capabilities and core business fundamentals.
◉ Company Overview
Indo Count Industries Limited NSE:ICIL , established in 1988, is a leading Indian home textile manufacturer. The company offers a diverse range of products, including bed sheets, fashion bedding, utility bedding, and institutional bedding. With showrooms in the UK and US, Indo Count sells its products under 17 distinct brands through multi-brand outlets, large format stores, and e-commerce platforms. Headquartered in Mumbai, India, the company exports its products globally.
◉ Market Capitalization - ₹ 6,288 Cr.
◉ Revenue Breakup (Location Wise)
➖ With a staggering 97.5% of its revenue generated from the US and UK markets, Indo Count Industries Limited has established itself as a prominent global player in the home textile industry.
➖ The remaining 2.5% of its revenue comes from domestic Indian sales.
◉ Challenges and Headwinds:
➖ Sales volume and revenue decline YoY due to supply chain issues, leading to higher inventory.
➖ Anticipated clearance of 2.5 million meters of deferred shipments in upcoming quarters.
➖ Revised EBITDA margin guidance: 15-16% due to upfront HR and brand promotion costs
◉ Margin Guidance and Future Outlook:
➖ Despite near-term challenges, Indo Count Industries Limited's management remains upbeat, fueled by a strong demand outlook and solid market positioning.
➖ Strategic investments in branded segments are expected to yield returns within the next four years, driving improved margin guidance.
➖ To further propel growth, the company is focused on enhancing operational efficiencies and scaling up operations in high-potential segments.
◉ CAPEX
➖ Indo Count Industries Limited has revised its FY25 capital expenditure (CAPEX) upwards to ₹413 crores, a significant increase from the initial estimate of ₹165 crores, driven by strategic acquisitions and investments.
◉ Strategic Acquisitions
➖ Recent acquisitions of Fluvitex Inc. and Modern Home Textiles, enhancing U.S. manufacturing footprint.
➖ Acquisitions strengthen presence in critical U.S. regions, expanding customer base without overlapping existing clientele.
◉ Technical Aspects
➖ Over a prolonged consolidation phase, the stock price developed a Cup & Handle pattern.
➖ Following a breakout, the stock surged sharply, hitting an all-time high near the 448 level.
➖ Nevertheless, it faced significant resistance and retraced to the previously established breakout level.
➖ Currently, the price is at a crucial point that could act as an important support zone.
➖ There is strong anticipation that the stock may rebound from this level and begin to rise again.
◉ Relative Strength
The chart reveals that Indo Count Industries Limited (ICIL) has lagged behind the Nifty Small Cap Index over the past year, generating a 12.7% return compared to the index's impressive 26.3%.
◉ Revenue & Profit Analysis
● Yearly
➖ Indo Count Industries Limited reported strong growth in Fiscal Year 2024, with revenue reaching ₹3,557 crore, an 18% increase from ₹3,012 crore in FY23.
➖ EBITDA surged to ₹562 crore, up from ₹455 crore, while the EBITDA margin improved to 16% from 15%.
● Quarterly
➖ In the quarter ending September, the company's revenue rose to ₹1,036 crore, a 10% increase from ₹941 crore in the previous quarter, slightly higher than ₹1,009 crore in the same quarter last year.
➖ EBITDA for the quarter increased to ₹157 crore, up from ₹145 crore in the previous quarter.
➖ However, diluted EPS (LTM) declined to ₹15.62 in September from ₹17.27 in June 2024.
◉ Valuation
● P/E Ratio
➖ The company's present price-to-earnings (PE) ratio stands at 20.3, lower than its 1-year median PE of 21.4.
➖ When we look at the industry average PE of 26, it indicates that the stock might be considered somewhat undervalued at this time.
● P/B Ratio
➖ ICIL's P/B ratio of 2.86 indicates considerable overvaluation compared to the industry average of 1.46.
● PEG Ratio
➖ A PEG ratio of 0.49 suggests that the stock is undervalued relative to its expected earnings growth.
● Intrinsic Value
➖ Indo Count Industries is currently trading at ₹307, which is nearly 1.1 times its intrinsic value of ₹279, indicating that the stock is fairly valued at this moment.
◉ Cash Flow Analysis
➖ The operating cash flow for Indo Count Industries Limited experienced a notable decline from ₹755 crore in FY23 to ₹146 crore in FY24. This decrease can be attributed to the strategic allocation of capital towards acquiring prominent brands, such as Wamsutta, as part of the company's expansion and growth initiatives.
◉ Debt Analysis
➖ ICIL's debt of ₹1,461 crore and debt-to-equity ratio of 0.66 indicate robust financial health. Furthermore, its impressive interest coverage ratio of 5.74 suggests the company is well-positioned to manage its debt obligations, ensuring greater financial flexibility and stability.
◉ Top Shareholders
➖ The promoters have maintained their 58.74% stake for the last two years.
➖ Foreign Institutional Investors (FIIs) have maintained their stakes since June, now holding 10.69%.
➖ Domestic Institutional Investors (DIIs) have continuously increasing their stakes from June 2023 and now holding 3.67%, significantly up from 2.16% from the June quarter.
➖ At the same time, retail investors have been consistently selling their shares over the past few quarters.
**Additionally, Mukul Mahabir Agarwal , a veteran investor, places a strategic bet on Indo Count Industries Limited, acquiring 1.17% of the company's shares, a move poised to reap rewards.
◉ Mutual Fund Exposure
➖ Indo Count Industries Limited witnessed increased institutional interest in October 2024, with thirteen funds holding 70 lakh shares, representing a 9.3% rise from September's 64.1 lakh.
◉ Conclusion
Based on our analysis of key technical and financial metrics, Indo Count Industries Limited's strategic focus on diversification, acquisitions, and premium products positions the company for sustained growth and long-term value creation.
We anticipate that this positive trajectory will be reflected in its stock price performance.

SAIL - Elliott Wave SAIL (Steel Authority of India). It seems to be in a running or expanded correction with currently wave 'c' ongoing. Price could test either the 50% of even 61.8% fib. level before turning bullish.

BAYER CROPSCIENCE - Potential 40% upmove Mid Term IdeaThe stock is in strong uptrend.
Moving out of a 4 year old consolidation zone.
Coming out of a 5 week old
consolidation, Daily VCP Breakout.
Ready for Swing Targets
15% 8215, then 9579 - Short To MId Term Targets 3-6 months.
SL 5% 6576 Daily closing Basis.

NIFTY50 || RSI positive divergence As mention in my previous idea, the recent rally was indeed a 'Dead Cat Bounce' as NIFTY50 has experienced another significant drop. However, examining the charts above reveals positive RSI divergence in both the 2-hour timeframe (TF) and the daily timeframe (DTF), with NIFTY reversing from a marked support zone.
For the next bull run to be confirmed, NIFTY should hold above today’s low and meet the following two criteria:
1. The index begins trading above the 20 EMA band.
2. The RSI surpasses the 70 mark.
This setup could indicate a more sustainable upward trend if both conditions are fulfilled.
Disclaimer: This analysis is for informational purposes only and should not be considered as financial advice. Trading involves significant risk, and it’s essential to perform your own research or consult a financial advisor before making any investment decisions.
Essential principles for traders:
1. Be Disciplined, Avoid FOMO: Maintain a disciplined approach to avoid impulsive decisions based on the "fear of missing out" (FOMO), which can lead to risky trades.
2. Risk and Reward Management: Always assess potential rewards relative to risks before entering a trade. Proper risk management ensures long-term success by limiting losses on any single trade.
3. Follow Stop Losses: Calculate and set a stop loss for every trade to protect against significant losses. Make it a habit to adhere to it without exception, even if the market seems to be in your favor.
4. Journal Your Trades: Maintain a trading journal to track decisions, wins, and losses. Analyzing past trades can help improve future strategies and identify patterns in behavior or biases.
5. Master One Strategy Before Expanding: It’s beneficial to focus on mastering a single trading strategy before exploring others. Once consistent, you can broaden your approach to diversify risk and opportunities.
6. Control Emotions: Emotions, especially greed and fear, can cloud judgment. Cultivating a mindset that balances confidence and caution is key to maintaining objectivity.

APOLLOHOSPITAL 240 MINS TIME FRAME - MY VIEW ONLYThe Structure looks good to us, waiting for this instrument to correct and then give us these opportunities as shown on this instrument (Price Chart).
Note: Its my view only and its for educational purpose only. Only who has got knowledge about this strategy, will understand what to be done on this setup. its purely based on my technical analysis only (strategies). we don't focus on the short term moves, we look for only for Bullish or Bearish Impulsive moves on the setups after a good price action is formed as per the strategy. we never get into corrective moves. because it will test our patience and also it will be a bullish or a bearish trap. and try trade the big moves.
we do not get into bullish or bearish traps. We anticipate and get into only big bullish or bearish moves (Impulsive Moves). Just ride the Bullish or Bearish Impulsive Move. Learn & Know the Complete Market Cycle.
Buy Low and Sell High Concept. Buy at Cheaper Price and Sell at Expensive Price.
Please keep your comments useful & respectful.
Keep it simple, keep it Unique.
Thanks for your support
Tradelikemee Academy
Saanjayy KG

Hero Motor ViewHero motor might take reversal from 4600 or 4300 levels as marked.
Chart is shared only for the educational purposes.

GBPUSD: Updated Chart, Price is Approaching Buying Zone! FX:GBPUSD
As we previously stated in our chart that we expect price to drop nearby to our entry zone however, price continued to rise and then started dropping please be minded that there Amy be early price mitigation due to this vary reason. In our opinion stick with the plan and do not take any early entry as there may be trap before the actual trade begins. good luck.

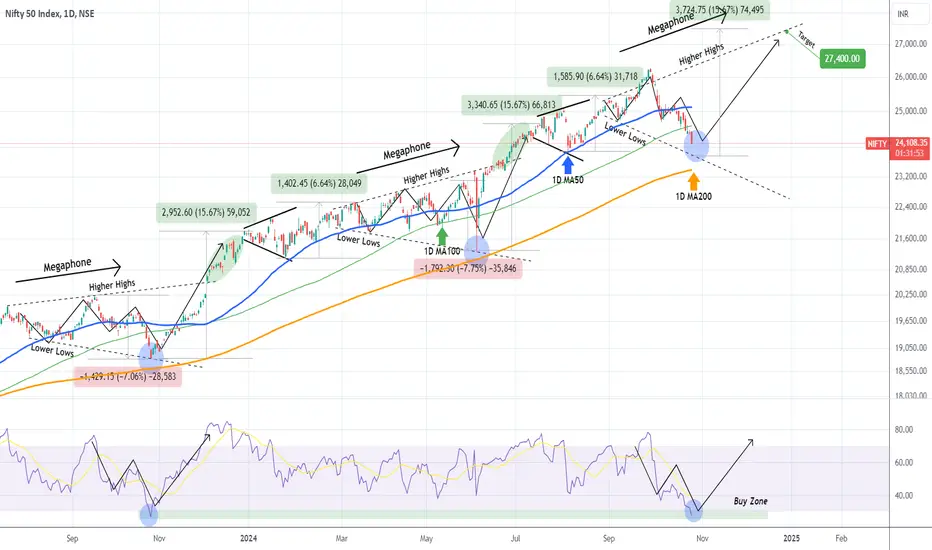
NIFTY Buy opportunity on solid cyclical patterns.We last looked into the Nifty 50 Index (NIFTY) on September 05 (see chart below), when we got an excellent buy on the 1D MA50 (blue trend-line) that quickly hit our 25700 Target:
As you can see, our trading approach was based on the recurring technical patterns (Megaphones) since July 2023. Even though the current wide price action doesn't fit the former Megaphone patters, we can still call for a bottom soon as, not only is the price approaching the 1D MA200 (orange trend-line), but also the 1D RSI is almost on the same oversold (below 30.00) level as 1 year ago (October 26 2023)!
In fact the pattern of September - October 2023 looks very similar to Sep - Oct 2024. The risk of buying here is low while the reward is high, making for a very appealing R/R ratio. As a result, we turn long again, targeting 27400 (+15.67% rise as the previous bullish break-out legs).
-------------------------------------------------------------------------------
** Please LIKE 👍, FOLLOW ✅, SHARE 🙌 and COMMENT ✍ if you enjoy this idea! Also share your ideas and charts in the comments section below! This is best way to keep it relevant, support us, keep the content here free and allow the idea to reach as many people as possible. **
-------------------------------------------------------------------------------
💸💸💸💸💸💸
👇 👇 👇 👇 👇 👇
WAAREE Short Trade Targets in Play, Massive Drop to 1571!WAAREE (15m time frame), Short Trade
Entry: ₹1,763.00
Current Price: ₹1,571.00
All Targets Done!
Key Levels:
Entry: ₹1,763.00 – After confirming a strong bearish signal, short entry was executed.
Stop-Loss (SL): ₹1,767.60 – Placed above key resistance to protect against potential reversals.
Take Profit 1 (TP1): ₹1,757.30 – First target triggered, confirming downward movement.
Take Profit 2 (TP2): ₹1,748.10 – Critical support level broken.
Take Profit 3 (TP3): ₹1,738.90 – More aggressive downside level confirmed
Take Profit 4 (TP4): ₹1,733.25 – Final target hit for deep correction in this trend.
Trend Analysis:
WAAREE’s price continues to plunge after a decisive break below multiple support levels, confirming strong selling pressure. With the current price at ₹1,571, this trade has captured a significant move, with further downside potential still in play.

BANKNIFTY | Long Term | NSEDay : Took Sell-side Inducement / LQ
15m : Long Position after Bullish Reaction / Confirmation Candle

Jio Financial Services (JFS): Navigating Key Levels with PositivJio Financial Services (JFS): Navigating Key Levels with Positive Momentum
NSE:JIOFIN (JFS) is currently at a critical juncture, testing key support and resistance zones amidst positive market sentiment.
Resistance Zones: 346 / 356 – The stock may face selling pressure near these resistance levels, but a breakout could signal renewed bullish momentum, especially considering the favorable news surrounding the company.
Support Zones: 335 / 316 – These levels are crucial for short-term support. If breached, it could lead to downside pressure, but strong buying interest at these levels may act as a cushion, preventing further decline.
Positive News Catalyst:
JFS recently received SEBI's in-principle approval to establish a mutual fund business in collaboration with BlackRock. This strategic 50:50 joint venture, dubbed Jio BlackRock, combines BlackRock's global expertise in investment and risk management with JFS’s strong local presence and digital infrastructure. This marks a significant re-entry for BlackRock into the Indian market, positioning JFS for expanded offerings in the investment space.
With this venture, JFS is poised to bring innovative financial products to the Indian market, which could attract investor interest and drive future growth. Positive sentiment from this news may create bullish momentum, and a break above the 356 resistance level could trigger further upside.
Key Takeaway: The stock is likely to be influenced by both technical and fundamental factors in the near term. Traders should watch for price action near the 346 and 356 levels for potential breakouts, while monitoring support at 335 and 316 for signs of strength.
Disclaimer: I am not a SEBI-registered Research Analyst. This analysis is for educational purposes only. Please conduct your own research or consult a financial advisor before making any trading decisions.

minda corporation buy trade Entry point :- 580.50
Stop lose :- 499.30
Risk 1% of capital
Target 1 :- 699.95
Target 2 :- 758.85
Target 3 :- 848.65

SHIVAMAUTOHi guys, In this chart i Found a Demand Zone in SHIVAMAUTO CHART for LONG entry,
Observed these Levels based on price action and Demand & Supply.
*Don't Take any trades based on this Picture.
... because this chart is for educational purpose only not for Buy or Sell Recommendation..
Thank you

BAJAJFINSERVTechnicals:
1) A triangle pattern has formed since Jan'2021.
2) The breakout from that pattern occurred after almost 3.5 years.
Please provide ideas if any...
***Disclaimer: Strictly for discussion purposes and not for making decisions on investing in the stock

Buy Bajaj Auto Short Term Trading Advice by Goodluck Capital
Buy Bajaj Auto
Buy Range- 9400 - 9600
Target- 10200 - 10400
StopLoss- below 9000
Potential Return- 7-9%
Approx trade duration 14 - 15 days
